Posts in Managing your Portfolio
Do's and Dont's of a Bear Market
 

It can be agonizing to watch your portfolio decline during a down market. Our human nature is to react erratically, which can be destructive to your financial plan. While it is important to stay the course, that doesn't mean you need to be idle. There is always an opportunity to do something to better your financial house. Here are a few productive things you can do as an investor during a down market: 

Do: 

Take Advantage of Opportunity

Invest cash: Risk assets like stocks are discounted, and as such, now may be a timely opportunity to invest the cash you have on the sidelines. Yes, markets may go down further, so be prepared for additional short-term losses. When investing additional dollars, don't let a desire to time the market-bottom perfectly get in the way of taking advantage of the opportunity.

Look for opportunities to Tax-loss harvest: Tax-loss harvesting allows you to get a tax break for poor-performing investments in a brokerage account. This strategy allows a taxpayer to offset other taxable gains and potentially claim a deduction against ordinary income. This is an unseen benefit for investors who have a brokerage account and want to use poor-performing investments to lessen their tax burden. (See Tax Tips in a Down Market

Keep an Eye on your Financial Goals

Rebalance: Market moves can result in a drift of your account's investments. Rebalancing your investments to your desired investment strategy can restore the appropriate level of risk and return to your account. Making sure you have an appropriate amount in stocks will help you take advantage of the possible market rebound. 

Accelerate Savings: Are you systematically saving into an investment account, such as a 401(k), IRA, or brokerage account? Consider making a larger contribution now to take advantage of the opportunity. This is a similar thought process to investing cash. 

Roth IRA conversions: Stock market downturns make for an opportunity to convert traditional IRA dollars to a Roth. When you convert dollars to a Roth IRA, you are responsible to pay income tax on the conversion amount. You are trading the tax-deferred (pay taxes when you withdraw) growth for tax-free growth. Before you complete a Roth conversion make sure you understand the tax implications and talk to your advisor or tax professional. 

An example: Your IRA was valued at $10,000 and is now valued at $8,000 due to market loss. To convert your IRA to a Roth, you would pay income tax on $8,000 rather than the previous amount of $10,000. Any growth from the time of the conversion is now tax-free for qualified withdrawals.  

Stay Educated

Read a book - My favorite personal finance book is the Psychology of Money by Morgan Housel. Housel provides timeless lessons about personal finance, human behavior, and long-term investing. Give it a read and let us know what you think. 

Don’t:

Don't invest short-term cash: Strategic cash cushions do have a significant place in a financial plan. Now is a prudent time to assess your cash holdings. Never use short-term dollars to invest. 

Don't watch your account or market too closely. Staring at a screen during periods of market fluctuations can be poisonous to your emotional wellbeing. Log out, take a deep breath, and go for a walk.

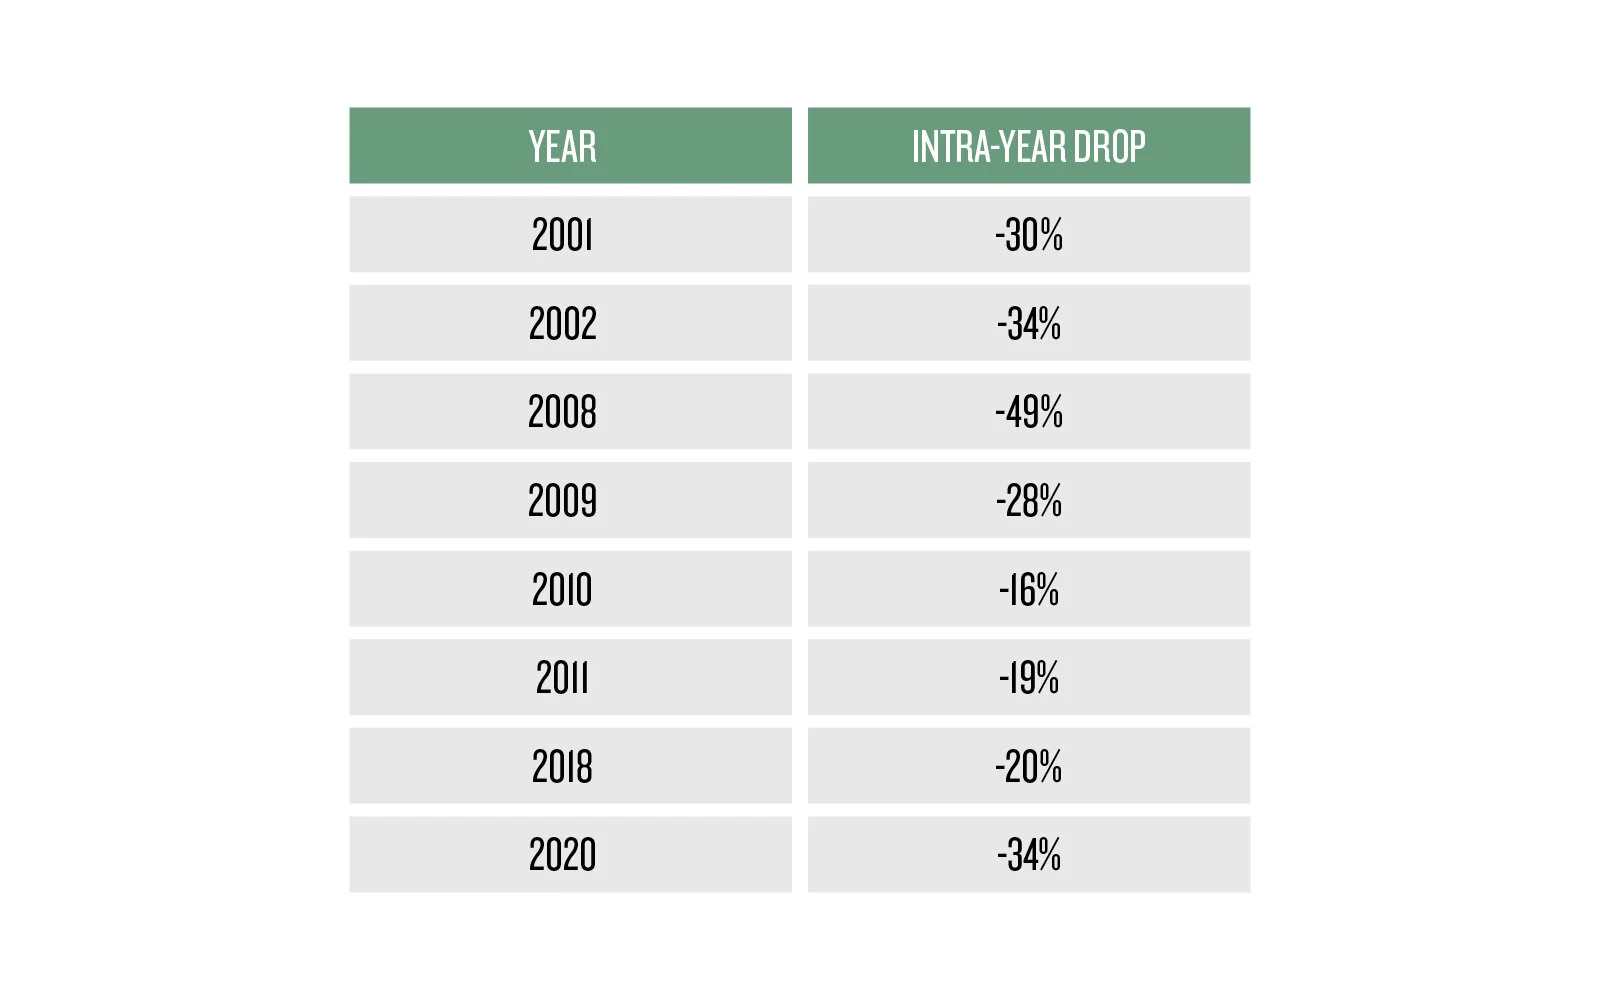
Don’t panic sell - The key thing for many investors is not to panic, stick to your plan. Remember that market declines are normal. This is the price of admission for long-term returns. 

 What We’re Doing for our Clients

Our team at Human Investing continues to carry our methodical approach to help steward our clients’ dollars. Our investment analyst team is constantly looking for opportunities to tax-loss harvest and rebalance. All the while, our Investment Committee persists in our due diligence for opportunities to enhance our investment strategies. 

While it is important to stay the course, that does not mean you need to sit on your hands and do nothing. We hope to provide you with a list of constructive things you can do to better your financial plan. Please let our team of credentialed advisors know if there is anything we can do to help you navigate the current market.  


Related Articles

Investing 101: How Dividends Work
 

A dividend is when a publicly listed company pays out a portion of earnings to shareholders. These can be paid out in cash or given as additional stock. These are given out to reward investors for entrusting their money with the company.

Who Determines the Dividend?

The Board of Directors decides two things:

  1. If they are going to issue a dividend or invest the profits back into the company

  2. The amount of the dividend

So, how does the Board make these decisions?

Whether or not a company issues dividends to shareholders often depends on how long the company has been around. Companies like Coca-Cola who have been around for a long time have lower growth potential and tend to pay a higher dividend because they see it as the best return for shareholders. If the Board of Directors thinks investing their earnings back into the development of the business will provide a greater return long term, they are most likely going to forego paying out a dividend or increase an existing one.

Many companies, especially newer companies, do not issue dividends. They retain earnings to help with future business activities. See the example below.

Important Dates to Note

These four dates are important to know if you qualify for a dividend and when you will receive it for owning shares of a company.

  1. Announcement date or declaration date: This is when the Board of Directors announces its intention to pay out a dividend.

  2. Ex-Dividend date: The ex-dividend date is the trading date on which the dividend will not be owed to a new buyer of the stock, this is one business day before the record date.

    For example: If the stock has an ex-dividend date of June 26th you will only receive the dividend if you purchased the stock before the 26th of June. If you bought the stock on the ex-dividend date or after you will not receive the dividend this time around.

  3. Record Date: This is the day on which the company checks its records to identify shareholders of the company.

    Note: If you own shares of the company on its record date and sell your shares after the date you will still receive the dividend for that period. If you want the dividend you need to make sure you purchase the stock at least two business days before the record date.

  4. Payment Date: This is the date the company issues the dividend and shareholders are paid out. Companies can pay dividends on a monthly, quarterly, or annual basis.

How Does the Dividend Affect Share Price?

When a company declares a dividend, the price tends to incorporate that dividend into the stock price. The day of the ex-dividend date is the day when the stock price is affected most by the dividend. Since new buyers of the stock will not receive the dividend the price of the stock typically drops by the dividend amount. This is because the dividend is locked into being received by the shareholders as of the previous market close, instead of the new buyers.

How to Receive your Dividend

To receive a dividend for owning shares of a company you must own the shares before the ex-dividend date. If you plan on buying the stock before the ex-dividend date, ensure you place the buy two business days before the record date so that trades have fully settled.

How are Dividends Taxed?

In the tax world there are two types of dividends: qualified and non-qualified.

Most dividends received will be qualified dividends where they will taxed at capital gain rates and receive preferential tax treatment. However, there are a few instances where dividends can be non-qualified and taxed as ordinary income. Such as the examples below.

  • Dividends paid out by REITs (Real Estate Investment Trusts)

  • Dividends paid on employee stock options

  • Dividends paid by tax exempt organization.

  • Dividends paid out by credit union, loan associations, insurance companies, mutual savings banks

Dividends are a Great Perk for Owning Stocks

Investing in companies that pay a strong dividend can be a good way to receive a return on your investment as they pay out cash on a monthly, quarterly, or annual basis. Keep an eye out for companies where the dividend isn’t sustainable based on profits. Lastly, make sure to know how your dividends are going to be taxed so you don’t have any surprises when tax time comes around.


Related Articles

Are Series I Bonds right for you to hedge against inflation?
 

There has been a lot of news on high inflation coming and its looming effects on everything from investment portfolios to the price of milk.

As people are searching for ways to combat high inflation and preserve how far their money can go, we’ve been receiving many questions on an investment option called I Bonds. Questions about what they are and why they haven’t heard of them before.

Our hope is to shed some light on Series I Savings Bonds (I Bonds), available here, and outline how the investment works before offering our recommendations.

How risky is an I Bond?

I Bonds are US treasury bonds, meaning they are backed by the full faith and credit of the US government, making them one of the safest, lowest risk investments possible.

What is the interest rate on an I Bond?

There are two parts to the interest rate on an I Bond.

  • A nominal (fixed) rate — currently 0% as of November 2, 2021.

  • An inflation (floating or adjustable) rate that changes every 6 months — currently 3.56% as of November 1, 2021.

These two rates are added together to determine the interest rate on an I Bond, so the current rate on the I Bonds for 6 months is 0% (nominal) + 3.56% (inflation) = 3.56% total (which is 7.12% annually). This interest rate cannot drop below 0% even if there is ever a negative inflation adjustment. See here for historical I Bond interest rates.

The floating rate on I Bonds will adjust as inflation adjusts. Today, inflation rates are high, but as the historical rates table in the link above shows, inflation rates can be lower.

When can I access my money?

An important factor to consider is that I Bonds only pay interest upon maturity, so you will not receive cash flows from the I Bond as you hold it.

I bonds have no secondary market, so you cannot resell your I Bond, you can only redeem it. I Bonds have no liquidity for the first year after purchase, so it’s important that you will not need to access the funds for at least one year. For years 1-5 after purchase, you may redeem your I Bond early by forfeiting the last 3 months of interest. After 5 years, you may redeem the bond early without penalty. I Bonds will mature 30 years after purchase.

How do the taxes work?

I Bonds only pay interest upon maturity. You can claim (pay) the taxes on the earned interest every year on your I Bonds, or you can pay taxes on all interest upon maturity of the I Bond. I Bond interest is not subject to state or local taxes. See here for more information.

How do I purchase I Bonds?

You have to purchase I Bonds directly through treasurydirect.gov, or with your federal income tax refund. See here for more information.

You are limited to $10,000 of I Bonds through electronic purchase, and $5,000 of I Bonds through paper purchase via your tax refund, for a total limit of $15,000 of I Bonds in a calendar year.

The pros and cons of waiting to get paid out

If you’re still wondering if these bonds are right for you and your financial plan, weigh the pros and cons below against your goals.

Pros:

  • The inflation adjustment makes I Bonds a great inflation hedge

Cons:

  • Interest is only paid out upon maturity, so don’t utilize I Bonds as a source of cash flows over time

  • Funds are locked up for 1 year, so don’t use I Bonds for any funds you might need before then

Other considerations:

  • I Bonds must be purchased on your own, so they’re for a more DIY inclined investor

  • The inflation adjustment rate will change adjust over time, so the precise amount of interest an I Bond will earn is uncertain

  • Consider the potential taxes of having all interest hitting upon maturity of the I Bond, or having to pay taxes each year on interest you have not yet received

  • You are limited on how much you can purchase in a year

I Bonds are typically best for medium term (i.e. around 5 year) savings goals.

The inflation adjustment reduces your risk of losing purchasing power due to inflation. The low nominal rates on I Bonds today means your funds will not grow faster than inflation.

For longer term savings goals (i.e. retirement in 10+ years), equities are a great long-term inflation hedge, because companies can adjust their prices (and therefore dividends & earnings) based on inflation. Treasury Inflation Protected Securities (TIPS) are another, lower risk than equities, investment that adjust for inflation.

If you have more questions about I Bonds, or would like to speak to a financial professional about other investments, please reach out to us at hi@humaninvesting.com or 503-905-3100.


Related Articles

The Real Risk of Owning Bonds: Too Much in Bonds May Hurt Your Purchasing Power
 

We talk to a lot of different people about investing. A common request is something along the lines of: “I don’t want to lose anything, and I want my money to grow.” This is a challenging, if not impossible mission. The investment world is full of opportunities to grow your money. However, there is an inherent risk when you put your money in any investment.

Finance has a lot of ways of measuring risk. Standard deviation is used to try to show a range of the possible returns. Max drawdown displays your worst-case scenario. Sharpe ratio provides a risk-adjusted measure of performance. However, very few investors ask about standard deviation, max drawdown, and Sharpe ratios. The people we talk to are most likely to ask “What are the odds of losing money” because they don’t want to see their current savings drop in value.

How strong is your purchasing power?

An important consideration when talking about losing money is purchasing power: the ability to buy goods with your money. Inflation has consistently pushed prices up over time, reducing the purchasing power of a single dollar. Wanting to avoid losing money is completely understandable. The danger of keeping your money under your mattress or sitting in cash is that inflation is constantly reducing your purchasing power.

When concerned with losing money, many investors are focused on nominal returns. Nominal returns are the raw return values, unadjusted for inflation, and are simple to calculate and digest. I would argue that most investors should be focused on real returns: returns adjusted for inflation. Real returns are a more accurate measure of your change in purchasing power. Ultimately, very few outside of Scrooge McDuck want a giant pile of money. Most people want to spend that money on goods, like food, travel, or a home, therefore purchasing power is likely what investors really care about.

Real return = (1+Nominal Return) ÷ (1+inflation rate)

Historically, stocks deliver positive returns, and those returns are in your favor. However, stocks are down (i.e. lose money) more frequently than bonds. The safety bonds offer also means they provide lower returns. What blend of stocks and bonds is most likely to protect your purchasing power (i.e. produce a positive real return)?

inflation is dwindling BOND power

To try and answer this question, I looked at the Stocks, Bonds, Bills, and Inflation (SBBI) data from the CFA Institute from 1926-2020. This data included monthly and annual returns; the annual data is for each calendar year. For stocks, I used the Ibbotson SBBI US Large-Cap Stocks total return.

For Bonds, I used the Ibbotson US intermediate-term (5 year) Government Bonds total return. I looked at several different portfolios which include a variety of stocks and bonds. Specifically, I blended the stocks and bonds in 10% increments, from 100% stocks, to 90% stocks 10% bonds, to 80% stocks 20% bonds, and so on to 0% stocks 100% bonds. I also assumed the portfolios were rebalanced at the start of each return period (i.e. the weights were reset at the start of each month for monthly data, and the start of each calendar year for annual data).

I took these different stock/bond portfolio mixes, and I calculated the nominal and real returns from 1926-2020 for both monthly and annual (calendar year) returns. I then calculated what percentage of returns were positive to measure the chance of losing money (nominal returns) or purchasing power (real returns). I’ve graphed the nominal vs real returns for monthly and annual returns below.

bonds-monthly-returns.jpg
bonds-annual-returns-v2.jpg

You’ll notice the nominal monthly returns paint a clear picture. If you want positive nominal returns more often, you want to own more bonds, hence the steady upward trend to the graph. If you look at the annual nominal returns and want to maximize your chances of a positive nominal return, you actually want a 10/90 portfolio (10% stocks, 90% bonds). As risky as stocks seem, having at least a sliver of stocks actually increases the chances of a positive nominal return

The real returns tell a slightly different story. For the monthly real returns, the stock/bond mix is almost irrelevant for producing a positive return, and hovers right around 60%. There is a drop off after 10/90 (10% stocks, 90% bonds), indicating owning even just 10% stocks in your portfolio helps increase your chances of positive real returns better than owning 100% bonds.

For the annual real returns, you can see that your odds of a positive real return are better with at least some bonds in the portfolio. Interestingly, the 70/30 portfolio and the 20/80 portfolios produce the highest chance of a positive real return. The all bond portfolio, 0/100, has the worst chance of maintaining your purchasing power (i.e. producing a positive real return).

Stocks can seem risky, and the loss of value can make many investors shy away. Even just a small amount of stocks can protect your purchasing power better than owning only bonds. There are still many considerations for how you should invest including your risk tolerance, time horizon, and holistic financial plan. If you’re interested in talking to an advisor, please reach out to us at hi@humaninvesting.com or 503-905-3100.


Related articles

The Importance of Portfolio Rebalancing and Market Timing
 
loic-leray-fCzSfVIQlVY-unsplash.jpg

What a season it has been.  I hope and pray that each individual and family member receiving this note is healthy and safe.  My goal over the coming months is to increase the volume of written communication.  These notes will not replace our regular scheduled tax, planning, or portfolio updates.  Instead, they will supplement those conversations and provide a financial perspective that can be communicated efficiently in writing.  The purpose of this note is to discuss our position on market timing and portfolio rebalancing.

Portfolio Rebalancing

We believe that the financial plan is the seminal document for investors seeking to accomplish long term goals. Each financial plan is prescriptive in the amount of saving and portfolio return that is required to accomplish the goals outlined in the plan.  The asset allocation decision is an important one—given it considers risk tolerance, time horizon, and financial goals[1].

The goal of rebalancing is to minimize risk and recalibrate, rather than to maximize return.  The process of rebalancing takes the imbalance that is created by certain asset classes over time and recalibrates those asset classes.  It takes the asset allocation that was originally prescribed by the financial plan and reorients the portfolio to its intended mix of stocks, bonds, and cash.

For most portfolios, recalibration should occur a few times a year.  This is particularly true in retirement accounts, given there is no tax liability for creating gains.  In trust accounts as well as individual and joint accounts, there is a sensitivity to tax gains as a possible consequence of rebalancing.  Every effort is taken to minimize tax liability in those types of accounts.  However, it can be hazardous to let the concern over taxes negate the discipline of regularly rebalancing.  I can think of too many instances where a client avoided rebalancing their account out of concerns for taxes—only to have the market go down. The tax liability for rebalancing was ultimately dwarfed by the loss of principle due to the market decline.  In short, it is rarely advisable to let the tax tail wag the investment dog.

Market Timing

The most common question I receive is, “when should we sell out?”  My typical response is never.  If an investor has a financial plan, which accounts for planning-based return expectations and subsequent asset allocation, the portfolio should always be properly positioned for risk and return.  If the goal of “selling out” is to reduce risk, the action of selling implies the original allocation was incorrect. 

In the past, there have been a few occasions where dramatically reducing risk by selling equities and raising cash makes sense.  Or, to sell a portion of the stock investment and place the proceeds in bonds.  But those reasons have to do with new information about the client situation, which prompt a change in the asset allocation. As an example, years ago, we had a client let us know that their business was struggling, resulting in the potential that their retirement account would need to be tapped for an emergency.  Liquidating equities in their account was a response to a change of plans and circumstances—this is a plan modification and not market timing. 

There is ample research dating back to the 1980s which suggests timing the market[2] or being able to predict the direction of the market is challenging at best[3].  Therefore, we believe in rebalancing “to recapture the portfolio’s original risk-and-return characteristics”[4], and we rely on the financial plan as the authoritative document to prescribe the proper mix of stocks and bonds for each client we serve.


Sources

[1] Zilbering, Y., Jaconetti, C. M., & Kinniry Jr, F. M. (2015). Best practices for portfolio rebalancing. Valley Forge, Pa.: The Vanguard Group. Vanguard Research PO Box2600, 19482-2600.

[2] Brinson, G. P., Hood, L. R., & Beebower, G. L. (1986). Determinants of portfolio performance. Financial Analysts Journal42(4), 39-44.

[3] Butler, A. W., Grullon, G., & Weston, J. P. (2005). Can managers forecast aggregate market returns?. The Journal of Finance60(2), 963-986. 

[4] Zilbering, Y., Jaconetti, C. M., & Kinniry Jr, F. M. (2015). Best practices for portfolio rebalancing. Valley Forge, Pa.: The Vanguard Group. Vanguard Research PO Box2600, 19482-2600.


Related Articles

How to Avoid the Investing Cycle of Emotions
 
alice-donovan-rouse-UweNcthlmDc-unsplash.jpg

Do not let your emotions get in the way of making smart investment decisions.

It is difficult to separate emotions from reality. We often view the world through the lens of whatever emotion we are experiencing, and unchecked emotions can give rise to suboptimal financial decisions.

My role as a financial advisor allows me to have many conversations focused around money. Through these conversations over the last 12 months, I have witnessed the gambit of the emotional response to the stock market and its volatility. What I discovered is that an individual’s emotional response tends to be heightened by three things:

  1. The more zeros at the end of their account balance.

  2. The amount of negative news consumed.

  3. The greatest of which, whether they have taken the time to build a financial plan.

In his book The Behavioral Investor, psychologist and behavioral finance expert, Dr. Daniel Crosby reminds us that our emotions can’t be trusted when it comes to making investment decisions.

“The fact that your brain becomes more risk-seeking in bull markets and more conservative in bear markets means that you are neurologically predisposed to violate the first rule of investing, “buy low and sell high.” Our flawed brain leads us to subjectively experience low levels of risk when risk is actually quite high, a concept that Howard Marks refers to as the “perversity of risk.” – Dr. Daniel Crosby

Like the stock market, our emotions are cyclical. This cycle of emotions experienced as an investor can range from pure euphoria to utter despondency (lack of hope).

Source: Russell Investments

Source: Russell Investments

This emotion is often not dictated by the investor, rather it is the investor’s response to the market. The wild thing is, we have seemingly experienced all of these emotions over the last 12-month period. Compare the cycle of emotion to the S&P 500 over the last year.

S&P 500 1 Year as of 8.19.2020

Is it a coincidence that these two images almost mirror each other? I don’t think so.

It is completely normal to have an emotional reaction to your finances. Your account balances are often in direct relationship to your future financial freedom and well-being. However, it is only when an investor acts on these emotions do they get themselves in trouble.

Investor’s making short term emotional changes to their investments hurt their chances at long-term returns. A study conducted by DALBAR, Inc. discovered that over the last 30 years, the average mutual fund investor underperformed the market by almost 6%! Their finding is that investor’s change investment strategies too often to realize the inherent market rates of return.

Here are some action steps for avoiding emotional investment decisions:

  • Look inward — Take an introspective look to acknowledge your emotional response over the last 12-month market cycle. Will you emotionally make it through another market drop? Right now is the time to build self-awareness, because the reality of the market is not IF it will have another correction, but rather WHEN.

  • Look outward — Do you have someone to help you make wise financial decisions throughout life’s many emotions and seasons? Someone, to stand between your emotions and your finances? This is one of the many ways a financial advisor can add value to your comprehensive financial well-being.

  • Look forward — Does your risk profile align with your financial plan? Are you taking on too much risk (or, too little)? Take some time today to review your holistic investment strategy and consider making any changes while the market has rebounded since its market low on March 23rd.

Our team at Human Investing realizes your family’s financial well-being is just as much “human” as it is “investing”. Let us know how we can help, contact us at Human Investing or call at 503.905.3100.


Related Articles

What is the Secret to Successful Investing?
 
financial-success.png

Through the end of 2019 and dating back 20 years, the S&P 500 returned 6.1%, as described in Table 1 below. During that same time period, a balanced account consisting of 60% stocks and 40% bonds returned 5.6%, while the “average investor” returned just 2.5%.

Table 1

Table 1

The “average investor”, according to JP Morgan and Dallbar, is any investor investing in mutual funds. The report shows the flow of mutual fund buying and selling. The use of mutual funds is the best way to perform a field experiment and infer approximate returns for those buying and selling mutual funds. 

It is implied that those buying mutual funds are more individuals, households, and smaller institutions. Larger institutional clients typically own the investments directly.

So, what’s the deal with the average investor returns?

Why don’t more people invest 100% of their money into the S&P 500 or something similar? The short answer is that while any investor can put their money into the S&P 500, few are able to hold through the ups and downs.

Table 2

Table 2

Looking at Table 2 (using the same 20-year time period), the S&P 500 has seen intra-year drops, that were on average nearly 14%. Investors owning just the S&P 500 would have had to hold tight over those 20 years to achieve the 6.1% return, which is easier said than done. To be sure, there is so much that goes into selecting an allocation for a portfolio. But given the times we are in, I thought it would be useful to lay out a framework for successful investing.

  1. Diversify — In my nearly 24 years of advising clients, I have seen just a few that have been 100% invested in equities. Since 1950, the average all-stock portfolio return was a little over 11%. Interestingly, a 50% stock and 50% bond portfolio for that same period yielded just under 9%. Although an investor may not have the temperament for an all-stock portfolio experience (because of the volatility described in Table 2), they can still save and invest. Through a balanced portfolio, investors can experience a fraction of the expected volatility while still achieving solid returns.

  2. Plan — It baffles me that so many investors focus on the return of the stock market. From my point of view, the only number that should matter is the return an investor needs to achieve their stated goals. Recently, we ran planning calculations for a client that needed 5.5% returns to make all of her financial goals come to fruition. Since working with Human Investing, she has achieved a 6% net return, allowing her to achieve all of her goals. Investors are best off spending time developing a plan and then building a diversified portfolio to achieve those plans. 

  3. Stay in the market — Since your financial plan serves as your road map to achieve your financial goals, it is imperative to stick to the plan. Following the plan means staying invested even when the world appears to be falling apart. But, what if you decide not to follow the plan and get out of the market? It may not be so much about the getting out of the market but about getting back in. Table three describes the negative impact of market timing. Although market timing can be costly, the greater challenge may be the decision on when to get back into the market.

  4. Investing is forever — Successful investors have a forever time frame they measure in a lifetime, not a day. The accelerating adoption of day trading, market timing, and other gambling-like tendencies go against everything I have ever read and learned about successful investing. Take, for example, Warren Buffett, whom many consider the greatest investor of our generation. He has amassed 95% of his wealth after the age of 65. Although I would place Buffett near the top of the list as the greatest investor of our generation, a key contributor to his wealth accumulation has been the length of time he has spent investing. This is a crucial lesson for those who look to get rich quickly and bypass the hard work of saving and investing over a lifetime.

Table 3

Table 3


Related Articles

Equity Returns Are in Your Favor: The Positives Outweigh the Negatives
 
michal-parzuchowski-GikVY_KS9vQ-unsplash (1).jpg

“Stocks are too risky for me.”

“You shouldn’t invest anything in stocks unless you’re prepared to lose all of it.”

“Investing is just another form of gambling.”

I have heard these concerns and many other reasons why people are nervous about investing, particularly in stocks. The ups and downs of the stock market can be difficult to stomach. This year, we saw one of the fastest drops in history as COVID-19 hit the world. The S&P 500 was down just over 30% from the beginning of 2020. Then stocks rallied back. At the end of July, the S&P 500 was positive for the year 2020. This is a wild ride no matter how you look at it.

The fear of short-term losses in investing is referred to as “myopic loss aversion”. The idea is that the fear of short-term losses scares investors away from riskier assets like stocks. As such, investors tend to invest more conservatively than they should, resulting in lower long-term returns.

Long-term stocks are a wonderful tool to grow your assets above the rate of inflation. Growing your savings and spending power over time is attractive, and for many it is essential to achieve their financial goals. The volatility of stocks along the way? No one looks forward to that. 

How risky are stocks in any given year?

If we look at historical returns for the S&P 500, a curious picture emerges:

s&p 500.jpg

Since 1937, the S&P 500 has had a positive return in 63/83 years, or 76% of the time. For reference, that is a solid “C” and a passing grade in any class I have taken.

For example, pretend you put $100 in the stock market on January 1 every year. In years with a positive return (76% of the time), on average you would see that $100 grow by 19.61% to $119.61. In years with a negative return (24% of the time), you would see that $100 shrink by an average of -12.19% to $87.81. Long-term, the odds are in your favor to grow your assets.

Invest with a Stable Foundation

There are certainly risks to owning stocks. It is important to ensure you have an emergency fund  to cover unexpected job loss or life expenses. It is also important to determine how much risk you can handle, both financially & emotionally, so you are not tempted to panic and sell when you see your account balance go down. A financial plan may be helpful to illustrate the dangers of investing too conservatively or too aggressively and may help to determine the risk that makes best sense for you.

If you need help understanding the risks and benefits of investing in equities, please contact our team at Human Investing. 


Related Articles

Test Your Financial Literacy With These 5 Core Questions
 

The financial world can be a confusing place filled with jargon, technicalities, and little to no guarantees. Research suggests that those who are financially literate tend to have better financial outcomes. Financially literacy is typically measured by asking some core financial concept questions. Let’s walk through some financial literacy questions from the National Financial Capability Study, and explain the why behind the answer. Feel free to guess and score yourself at the end:


Question 1 - interest:

Suppose you had $100 in a savings account and the interest rate was 2% per year. After 5 years, how much do you think you would have in the account if you left the money to grow?

A. Less than $102
B. Exactly $102
C. More than $102


Answer: C, more than $102.

Explanation: The key part here is “After 5 years”. We are told the interest rate is 2% per year. That means every year, 2% gets added to our principal balance. To break it down year by year:


q1 copy.jpg

The interest earned increases each year. This is due to compound interest: the original principal ($100) grows, and the interest you earned previously (in year 2, $2) both earn interest. At the end of 5 years, we have $110.41 which is C More than $102.

Why this matters: Interest affects you when you save money to grow it, or borrow money to pay it back later. Knowing how interest can work for or against you is critical for financial success.

Question 2 - inflation:

Imagine the interest rate on your savings account was 1% per year and inflation was 2% per year. After 1 year, how much would you be able to buy with the money in this account?

A. Less than today
B. Exactly the same
C. More than today


Answer: A, Less Than today.

Explanation: They key here is the inflation rate is higher than the savings rate. Inflation is growing at 2%, meaning the price of goods (rent, utilities, food, cars, etc.) is going up by 2% each year. The cost of $100 of goods today will be $102 in 1 year. Your interest on savings is growing at 1% a year. That means in 1 year you will have $101 to spend on goods. In 1 year, you will have $101 to buy $102 worth of goods. Your ability to buy is A less than today.

Why this matters: Even if you keep your money “safe” in the bank or under the mattress, inflation is going to make that money less and less valuable. Thus why investing is so important. Investing can be scary due to downturns in the market, but ultimately the odds are in your favor to grow your money over time. Unless you can save significant portions of your income, growing your savings faster than inflation is critical for being able to retire.

q2 copy.jpg

Question 3 - Risk Diversification:

Buying a single company’s stock usually provides a safer return than a stock mutual fund.

A. True
B. False


Answer: B, False.

Explanation: To answer this question correctly, it is important to understand both risk and that a mutual fund owns a variety of companies. They keyword here is safer. Financial markets have two types of risk: market risk and company-specific risk (aka systematic risk and nonsystematic risk respectively).

Market risk refers to risk all companies face. Examples of market risk include a change to the US tax code, a global pandemic, or shifts in consumer tastes like a shift from fast food to organic freshly prepared food. You will always face market risk because every company is exposed to these risks. Company-specific risk refers to risks unique to one company. Examples of company-specific risk include sudden changes in management, a press release about product defects, mass recalls, or a superior/cheaper product released by a rival company. Because you own a variety of companies in a stock mutual fund, you diversify away (i.e. reduce your risk) if any single, specific company has a terrible event.

Why this matters: Don’t invest all your money in one company. Especially if you work for that company, and your compensation is based on the company doing well. By spreading out your investments, you reduce your risk of catastrophic returns, and smooth out the ride so you can sleep at night.

Question 4 - interest of the life of a loan:

A 15-year mortgage typically requires higher monthly payments than a 30-year mortgage, but the interest paid over the life of the loan will be less

A. True
B. False


Answer: A, True.

Explanation: Because of the shorter life of the mortgage loan, you pay less interest. Remember in question 1, interest compounds every year. When you borrow money, that compounding works against you. Therefore, the faster you are paying off debt, the less time for interest to compound and grow the total amount you have to payoff. The monthly payments are typically larger, but the overall interest paid is less.

To illustrate with numbers, let’s look at the difference between a 15 year & 30 year mortgage, assuming a 5% interest rate for both:

q3 copy.jpg

Why this matters: You can see from the example how much money is saved by opting for a 15 year mortgage. Can you afford that extra monthly payment? That’s worth investigating, but you’ll never explore your choices if you don’t know what they are. You can also usually get a lower interest rate for shorter term debts, which saves you even more money. Anytime you borrow any amount of money, the faster you can pay it off, the less you will pay total. Even if you don’t get a lower rate on the debt, if you pay off the principal sooner, that means there’s less interest compounding against you. When looking to borrow money, evaluate what term (length of time) works best for you and your budget. You want to minimize your cost of borrowing, but you also want to give yourself enough flexibility that you’re confident you will make all those payments on time, regardless of what life brings.

Question 5 - Bond prices and interest:

If interest rates rise, what will typically happen to bond prices?

A. They will fall
B. They will stay the same
C. They will rise


Answer: A, they will fall.

Explanation: This is the question most people get wrong. A bond is government or corporate debt. The government or company pays you coupons (interest payments) based on the issued interest rate. At the end of the bond’s life, it matures, and you get the principal back.

Imagine Disney issues bonds paying 5% interest, the current market rate. You purchase a bond for $1,000, and you get a $50 coupon payment from Mickey Mouse every year until the bond matures. If interest rates rise next year (say to 8%), and Disney issues new bonds, they will issue them at the new interest rate. Your neighbor Laura decides to buy $1,000, and she gets an $80 coupon from Mickey Mouse every year. Because interest rates rose, the value of your bond paying $50/month goes down in value, less than $1,000, because the $1,000 could buy Laura’s bond paying $80/month. The reverse if also true. If rates had fallen to 3%, Laura’s bond would only pay her $30, and your $50/month bond would be worth more than $1,000.

Why this matters: Interest rates change over time. This causes bond prices to change. Bonds will still be less volatile than equities, but they do also fluctuate in value. Don’t panic when you see interest rates rise, and your bond prices going down in value. This is both normal and expected. Rising interest rates are also usually a healthy sign for the economy, and so your equities will generally be rising in value to help offset the loss in value of your bonds. The reverse is also true here. Falling interest rates tend to indicate a less healthy economy (think about when rates have dropped significantly & quickly; the 07-08 financial crisis and COVID-19) which means falling stock prices. Because they don’t tend to move together (uncorrelated), bonds and stocks are an excellent pair for smoothing out your investment returns.

How did you do?

If you got some questions wrong, I hope you understand the why behind the answers and how to utilize this knowledge to better your financial life. If you have questions about financial vocabulary or systems you’d like me to blog about, please email me at andrewg@humaninvesting.com. If want to talk to an advisor, please email us at hi@humaninvesting.com.


Related Articles

Maximizing the Effects of Trade Wars
 

Do trade wars have an impact on the economy and market? The simple answer is…

It depends (Freeman, 2004).  Krishna, Mukhopadyay, and Yavas (2002) determined that free-trade can hurt the economy when capital markets are distorted.  While at the same time, trade can positively impact the economy when labor markets are in equilibrium.  Whether you are a free market zealot or, believe globalization was an experiment gone wrong, this trade war is not just about trade and tariffs.  It is a part of a much larger conflict between the U.S. and China, which in addition to trade/tariffs, encompasses politics, ideology, and even the current global geopolitical order.

In our view, regardless of the outcome of the current trade negotiations, this is just one chapter in a book that will continue to be written over the decades to come. Anyone looking for a neat and clean expeditious resolution will likely be disappointed. The uncertainty surrounding this conflict will continue for a long time and is out of our control. 

So, what can be agreed upon and has strong academic roots?

What appears to be universally accepted is policy to eliminate deficits, maintaining market-oriented exchange rates, improving the education system, strengthening the legal system, and increasing competition amongst domestic firms (Baldwin, 2003).  These are essential economic considerations both now and into the future—and what will move the needle long term for our economy, our markets, and our country.

How can you prepare for what happens? Having a Financial Plan.

At Human Investing, we emphasize comprehensive financial planning (we call this hiPlan™), which is very different from traditional planning, which tends to focus on a single area such as investing or insurance. By taking a comprehensive approach, we can create stress-tested, long -term, adaptive plans for our clients and gaze beyond the short-term implications of news headlines.

Further, we work as a team to serve our clients.  Much like a peloton where each team member jumps out front to take the lead when appropriate, we've assembled a team of financial planning experts—each with specific knowledge that our clients can leverage for their benefit.  So why are we so focused on financial planning?  For us, the answer is simple, empirical evidence points to its advantage, and we have personally seen it work for the clients we serve.   

Several studies have shown that individuals and families who employed the financial planning process enjoy greater wealth during retirement versus those who fail to plan (Hanna & Lindamood, 2010) (Van Rooij, Lusardi, & Alessie, 2012). As a non-commissioned, fee-only firm, we can provide the most objective and independent advice, making it more feasible to optimize the financial well-being of our clients. We believe that by working with our expert team and taking a long-term and comprehensive approach to financial planning, our clients can have peace of mind regardless of the headline of the day.

Have you started your plan today?

If not, or, if you are interested in learning more about our people and process, please call us at (503) 905-3100 or let us know about your needs.

References

Baldwin, R. E. (2004). Openness and growth: what's the empirical relationship?. In Challenges to globalization: Analyzing the economics (pp. 499-526). University of Chicago Press.

Freeman, R. B. (2004). Trade wars: The exaggerated impact of trade in economic debate. World Economy27(1), 1-23.

Hanna, S. D., & Lindamood, S. (2010). Quantifying the economic benefits of personal financial planning.

Krishna, K., Mukhopadhyay, A., & Yavas, C. (2005). Trade with labor market distortions and heterogeneous labor: Why trade can hurt. In WTO and World Trade (pp. 65-83). Physica-Verlag HD.

Van Rooij, M. C., Lusardi, A., & Alessie, R. J. (2012). Financial literacy, retirement planning and household wealth. The Economic Journal122(560), 449-478.


How to Avoid the Negative Compounding Effect of Fees on Your Account
 
leaky-bucket-fees.jpg

Despite the recent awareness around fees in today's environment, it can still be challenging for investors to know what and whom they are paying.

I was reminded of this recently when we had the pleasure of welcoming a family in as new clients to our firm. When they first reached out to us, they knew something was not right with their investment situation. After reviewing their statements and a discovery call, we quickly found out why. They were being overcharged and underserved. It turns out their fees were roughly 2.12% per year. At the same time, the level of service they were receiving included one phone call per year, online access and statements.

In this article, my goal is to unwrap the fee structure that this family experienced, highlight the long-term negative impact and then provide an awareness that can help you avoid this situation.

Moreover, while this article focuses on the experience of a single family, we have seen the same cost structure apply directly to institutions as well, whether an endowment, foundation, ERISA retirement plan or other types of institutional assets.

The step-by-step on how to give up 25% of your market returns to your advisor (not recommended!)

The family mentioned above did not realize they were charged fees on fees. One layer included an advisor fee of 1.40% per year with limited services. Unfortunately, industry expertise, full client engagement, risk management, along with estate and financial planning were not part of the offering. 

The second layer of fees was the underlying costs of the investments held in the portfolio—which was new information to the clients. Even though they had a diversified mix of “institutional” mutual funds in their account, the average expense ratio of these investments was 0.72%, which was added to the 1.40%.

 Without digging deeper into other potential underlying fees such as trading costs and custodial fees, the total costs were 2.12% per year. (1.4% + 0.72% = 2.12%)

Assuming a 9% long-term average return(1) in the stock market, these clients had been giving up almost 25% of return per year in fees. Unless there is some other form of benefit or return the client is receiving, this is retirement money down the drain. In Peter Fisher’s 2018 article in Forbes titled, “Why Conflicting Retirement Advice is Crushing American Households,"(2) he points out that the annual cost of conflicted investment advice in the US is $17 billion per year. The scenario outlined in this article is case in point.

The Negative Compounding Effect of Fees

The diminishing effects of the high fees & low service model outlined above are significant. To illustrate, I have provided a compare-and-contrast to what I believe is a more reasonable fee structure of 0.85% in total fees. (This includes an advisor fee of 0.75% and underlying investment fees of 0.10%.) 

After backing out the fees for both scenarios, the difference in future account value after 20 years of saving and investing is $343,000.

If you are an institution, add a zero or two to the end of each number for a better comparison on the effects to your business, organization, non-profit, endowment, foundation, or other.

fees.jpg

Is the “advisor” adding $343k worth of value? That amount would more than cover health care costs for a married couple throughout their retirement years, according to recent studies(3).

 To be clear, advisors can add significant value to a client relationship. Vanguard produced a research piece called the Advisors Alpha®(4) that makes the case that an advisor can add significant value beyond the fee they charge. However, it comes through a combination of wise stewardship and planning, portfolio construction and tax efficiency. In short, it is much work that deserves fair compensation. The challenge with the scenario outlined above is that any advisor would have difficulty justifying their value at that fee level when their only service is setting up an allocation and checking in once a year.

How You Can Avoid This

Having open and honest communication with your advisor is essential. Here are a few questions to ask that can help you determine if your advisor is acting in your best interest and has a compelling service and fee offering:

Fees & Services: What services will I receive and how much will it cost?

  • Service and fee schedules should be clearly outlined so you can determine what you are receiving and how much you are paying. You will be able to measure the potential "Advisors Alpha®." A contract should explicitly outline fees and the commitments being offered such as discretionary investment management, planning services, meetings per year, insurance reviews, risk management, estate planning, reporting and more. If you are an institution this will look slightly different, but it will still be the same idea. If your advisor cannot tell you exactly how they are going to serve you and what their charges will be, it might be best to keep looking.

Investment Fees: What is the fee for the underlying investments held in my account?

  • This question will help you asses the total fee that you will be paying and not just the advisors fee. Typically these investment costs can be minimal for accounts that use individual stocks, bonds, Exchange Traded Funds (ETFs) and index funds. However, for accounts that use actively managed mutual funds, insurance products or Separately Managed Accounts (SMAs), these fees can add up and take a toll on your long-term return.

Are you a Fiduciary: Are you a legal, written Fiduciary in all matters?

  • If your advisor is not a legal, written Fiduciary in all matters, beware that they have the flexibility to not apply Fiduciary standards in serving you. If they are a Registered Representative, Investment Representative, Broker or Insurance related, there’s a good chance they do not have to act in your best interest.

Are you an Expert: Do you have credentials or an advanced degree in your field of practice?

  • Your advisor should continue to learn and grow throughout their career. Legally, all advisors and brokers must have individual licenses such as the Series 6, Series 65, Series 7, etcetera. This does not make an advisor an expert. It is merely the cost of admission and is the SEC and FINRA's attempt to ensure there is some form of standard in the industry. Look for credentials such as CFA, CFP, CPA, or CIMA and for advanced degrees such as Master’s in Financial Planning or Master of Science in Finance. In short, credentials and advanced degrees help demonstrate the continued efforts of an advisor to learn and stay on top of trends in an incredibly complex and dynamic profession.

If you have questions about this article or any personal or institutional financial needs, we would love to help. Please do not hesitate to reach out to our team.

(1) According to the Chicago Booth Center for Research in Security Prices, from 1/1/1926 to 12/31/2017 the compound annual returns for US stocks were 10.0% and for international stocks, 8.0%. In this article, I have assumed an arbitrary and straightforward 9% average return solely for illustration. This does not constitute investment advice and should not be relied on as such. http://www.crsp.com/resources/investments-illustrated-charts

(2) https://www.forbes.com/sites/forbesfinancecouncil/2018/08/17/why-conflicting-retirement-advice-is-crushing-american-households/#4ddfd4f71355 

(3) https://www.fidelity.com/viewpoints/personal-finance/plan-for-rising-health-care-costs

(4) https://advisors.vanguard.com/VGApp/iip/site/advisor/researchcommentary/article/IWE_ResVgdAdvisorsAlpha


Related Articles

What You Need to Know About Sequence Risk
 

Image credit: Amol Tyagi

Over the last nine months since my daughter was born, I have learned to hear and translate her grunts, squeals, cries, and even noises that sound very similar to what a pterodactyl probably sounded like. The other night I woke to a cry that was not familiar. In her sleep she had stuck her foot through the slats in the side of the crib, but when she turned to pull her foot out, she could not; her foot was stuck. Putting her foot in the space between slats was easy, pulling it out…well, that was a different story.

This experience can be similar to that of an investor who has saved well for retirement but may have difficulties withdrawing dollars due to Sequence Risk. Sequence Risk, also known as sequence of return risk, is the risk assumed by an investor taking withdrawals from an investment account when receiving lower or negative investment returns. Specifically, this becomes serious early on in someone’s withdrawal timeline, as the investor/retiree ends up withdrawing a larger portion of their total portfolio than planned. Knowing what Sequence Risk is and how to plan for it is instrumental to a successful long-term financial plan. To illustrate Sequence Risk and its impact, let’s first look at the 20-year experience of two investors who are not taking withdrawals (Scenario 1) compared to the experience of the same two investors who are withdrawing from their accounts during that same 20-year period (Scenario 2).

A Scenario of Two Markets

Investor A deposits a lump sum of $400,000 in the S&P 500 (500 biggest companies in the US) on January 1, 1998. Investor A does not touch her investments for 20 years and now her balance is over $1,600,000, despite both the Dotcom Crash and the 2008 Financial Crisis. A great reward for the disciplined long-term investor.

With Investor B we see a similar scenario. She deposits a lump sum of $400,000 in the S&P 500 and doesn’t touch it for 20 years. Except this time the annual returns of the S&P 500, while staying the same, are randomized in their order and weighted for an early market downturn of two consecutive years of negative returns (-37% and -22.1%). After 20 years Investor B arrives at the same balance of over $1,600,000.

Scenario 1:

chart1.jpg

For the long-term investor, the sequence of returns does not seem to influence the investor’s portfolio if he or she is not withdrawing from their investments. Both Investor A and Investor B, while having very different market experiences, arrive at the same place. A great case for the long-term investor to not balk at market volatility.

The Sequence Risk for a Retiree

Where the order of returns does impact the investor (i.e., a retiree) is when they begin withdrawing from their investments in a down market. To see the impact Sequence Risk has on an investor, we will look at the same investment returns experienced by Investor A and Investor B. In this scenario the difference is each investor will begin taking annual withdrawals of $20,000 (5% of beginning balance) at the end of each year.

With Investor A, we see after the market experience of the S&P 500 from 1998 to 2017, she would expect to have $618k after 20 years of retirement.

As for Investor B, when the market experience begins with a downturn for the investor, the retiree’s balance would be significantly less, only $193k. A difference in the order of returns can mean a difference of almost $425k, or a 1/3 of the portfolio size, after 20 years.

Scenario 2:

chart2.jpg

Why does it matter?

Two retirees with identical wealth can have entirely different financial outcomes, depending on the state of the market when they start retirement and begin taking withdrawals, even if the long-term market averages are the same.

What do you need to do?

While you cannot control what the sequence of future returns is, there are things you can do to impact the success of your financial plan. If you are a long-term investor, make sure you have a plan, revisit the plan annually, and stay disciplined. If you are already in or are entering retirement, it is important for you and your advisor to plan accordingly:

Assess your risk. Appropriately assess your risk as you are entering retirement years. Assuming more risk than necessary paired with a down market can make you greatly susceptible to Sequence Risk.

Lower retirement expenses. Pay off any debt (including mortgage payments) before entering into retirement. Having fewer expenses in retirement provides flexibility for when the markets get rocky and withdrawing less is prudent (based on what was just laid out about Sequence Risk).

Have a short-term strategy be a part of your long-term financial plan. Hold assets that allow for flexible spending without having to veer from your long-term strategy. Holding cash or fixed income investments can provide short-term income sources, helping you avoid withdrawing a large portion of your total portfolio in a down market.

Continue working. If entering into a market experiencing low or negative returns, keep your job. What no retiree wants to hear after a long career of hard work! However, continuing to save and to delay retirement withdrawals by even a few years has the potential to yield long-term exponential growth.

While my daughter had no issue putting her foot in the space between slats, the issue was pulling her foot out. Dad was able to save the day. Realizing the most efficient angle, I was able to help her pull her foot out. With investors, sometimes it takes someone to come alongside and help strategize the most efficient strategy to withdraw dollars, no matter what is going on in the market. If you are planning on retiring soon and want help building a tailored financial plan and assessing the risk on your retirement accounts, let us know. Human Investing is here to help.   

*Scenarios are used for illustration purposes only. Past performance is not an indicator of future outcomes.


Related Articles