Posts in Managing your Portfolio
Identifying your investment risk
 

Our solution to identifying your investment risk… and why it matters

This past weekend my wife and I went and visited two of our best friends in the hospital who just had a baby girl. When we got the text that the baby had arrived, we were in line at the Nike employee store. As we got up the counter, my wife became teary eyed with thoughts of happiness for our friends, as you can imagine the check in person didn’t quite know what to do! The cool thing about being at Nike at that time, was that we were able to pick up this little number as a gift for the newborn, which I would highly recommend simply because it's awesome.

Later that night we went to visit them, and I had not been to a doctor’s office/hospital in a while, and while I was there noticed the “pain tolerance scale” up on the wall in our friend’s room.

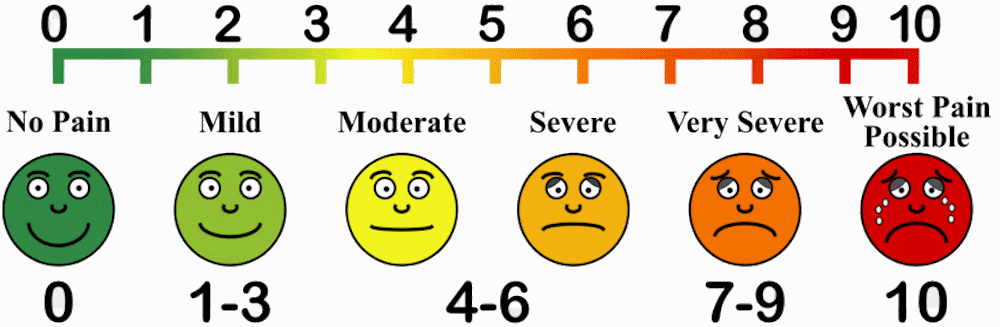
This scale has always made me laugh as often times it is usually relative and doesn’t define what the parameters are. What signifies a 10 on the pain scale? A broken leg? Something more painful? I know for me it was crashing my bike and meeting the gravel face first.

This got me thinking about a financial scale that many of us have seen before called the “risk scale”. Most people who have invested before have probably been asked the question, “Are you more of a conservative, moderate, or aggressive investor?” And most people say some form of, “Moderate, I think? I obviously want to make money but don’t want to lose it all”. Similar to the pain tolerance scale, the question needs to be asked; what does conservative, moderate, or aggressive mean? This is a reasonable question many people have a hard time answering. Human Investing has recently partnered with Riskalyze, a company that looks to provide tangible risk information that investors can act on.

risk 2

risk 2

Here is how it works: After completing a simple risk questionnaire you are given a risk score from 1 to 100. This score acts as a benchmark (investor lingo for pain scale) and explains what to expect during different market conditions. For example, if you are invested in the S&P 500 your risk score is a 78 according to the assessment. It also shows you that generally in a given 6 month period of time you can expect a best case return of 28% and a worst case return of -18% with a historical average rate or return of around 9%. As the investor, YOU get to decide if you’re comfortable with that and can look at different investment options or portfolios that fit your goals and timeline best.

So why does this matter? Because over time investors typically under-perform the market due to things like lack of discipline, changing strategies, and trying to time the markets. We believe that a more informed investor who understands their risk and the upside and downside of their allocation can fair better. When I show this tool to 401k participants I often use the following sound bite to explain that most investors are emotional and have a short-term view; In 2014 the 20 year backward looking S&P 500 annualized return was 9.85% while the average US equity mutual fund investor annualized return was only 5.19%! Yes you read that right. Over a 4% difference per year the average investor missed out on.

Our hope is by equipping investors with information like this people can have a better understanding of which investment mix is best for them and how to stick to it over time. Thus, creating higher returns by increasing discipline.

If you are looking for an explanation about the pain scale, I am just as confused as you and probably can’t help. But, if you would like to have a conversation about your risk score and how to implement it, don’t hesitate to email someone from our team or give us a call!


Related Articles

Market Perspective
 

When, for a variety of reasons, the stock market experiences downside pressure, I often spend a lot less time on the headlines and more time on the history. Because every market presents itself differently with no up or down move in the market looking exactly like another, I am compelled to look at what the market has shown us through data that goes back to 1825. After tearing up several drafts over the past few days, I pray I’ve struck the right tone in what you are now reading.  There are several key points I’d like to share after a long weekend of research.

Market Fluctuations Stock market fluctuations are an inevitable part of investing.  Declines in the market never feel good but are quite normal to experience.  History has shown us that declines have varied widely in intensity, length and frequency.

A History of Declines from (1900-December 2014) Dow Jones Industrial Average

Type of Decline        Ave. Frequency                          Ave. Length                 

-5% or more 3 times per year 46 days -10% or more 1 time per year 115 days -15% or more 1 time every two years 216 days -20% or more Approx. once every 3 1/2 yrs. 338 days


As a different point of reference, when observing the market between the years 1825-2013, I see the following:

  • The market had 134 positive years and 55 negative years (the market was positive 71% of the time)

  • 44% of the time, the market finished the year between 0% and +20%

  • 60% of the time the market finished the year between -10% and +20%

  • Only 14% of the time did the market finish worse than -10%

  • Less than 5% of the time did the market finish worse than -20%

  • The market was 5 times more likely to be up 20% or more in a year (50 out of 189) than down 20% or more (just 9 out of 189)!

Lessons learned from past markets:

  1. No one can consistently predict when market declines will happen.

  2. No one can predict how long a decline will last.

  3. No one can consistently predict the right time to get in or out of the market.

  4. The historical odds of making a gain in the market is good.

  5. The historical probability of losing money in the market on any given calendar year is low.

Investing and Emotions In economics and decision theory, loss aversion refers to people's tendency to strongly prefer avoiding losses to acquiring gains. Most studies suggest that losses are psychologically twice as powerful as gains.  I’ve studied loss aversion in the classroom, taught on loss aversion in an academic setting and lived through how this plays out for investors during market declines.  In short, emotions have the potential to destroy an investor’s ability to achieve their financial goals.

In an annual Dalbar study, the research firm stacks up investor returns vs. those of stocks and bonds.  The study, published in early 2015, looked at returns from 1995-2014 which showed the stock market averaging 10% per year for the previous 20 years where the average investor returned around 2.5% - just a hair over inflation.  Much of this underperformance can be attributed to overly confident investors purchasing when the market is reaching new highs and panic-stricken investors selling when the market declines.

Lessons learned from emotions and investing:

  1. Have a well thought out financial roadmap.

  2. Review the roadmap during both good and bad market cycles.

  3. Ask yourself, “Other than my emotions and the market, has anything changed with my financial plan and goals?” If not, stick to the plan. If things have changed, let’s talk.

  4. Historically, selling investment to relieve anxiety about the markets can be costly.

Summary We know the markets will surprise us.  The consensus estimates of “where the market will go and why” are most often wrong.  History will not repeat itself in the market the same way, but we can learn a lot from both historical data and behavior.

When the market is volatile, particularly when it’s in decline, it can be unnerving for many investors. The concept of “buy and hold” never sat well with me. I prefer “invest and assess.” Whether in stocks or bonds, investing has to be with a purpose and a plan - period.  Our team’s work is to serve you by synthesizing your information into a plan with a purpose. Having the plan in place, we practice “invest and assess” with the goal of offering you confidence in how your plan will play out both in and through retirement.


Related Articles

How to Stay Positive When the Market Gets Negative
 

When investors experience market turbulence, it’s never fun. It’s a lot like being on a plane when the fasten seatbelt sign goes on and the wings of the craft start flapping like a bird in air. Our investment firm has experienced 30% of the worst days in the market since the year 1899, so we’ve endured our share of turbulence. The purpose of this note is to address participants investing in their 401k plan and to share lessons we’ve learned from the past.

  1. Participants should understand what is “normal" turbulence in the stock market. A correction (aka turbulence) is typically defined by a decline of 10% or more with a “bear market” declining 20% or more. Although corrections and bear markets never feel good, they should be considered normal and expected. In the last 85 years, there have been 51 corrections or bear markets. In the last five years alone, we’ve had six periods of declines of nearly 8% or more. In short, normal never feels good but normal is normal.

  2. As the Dow Jones has increased in value from the year 1987 (1,793) to today (16,000), the drops in point value don’t have the same impact as in earlier times. Take for example the one day crash in 1987 where the market lost 8% of it’s value in a single day with a 156 point drop. If that same sort of drop were to occur today, we’d need to see a 1,600 point plunge. The bigger number seems scarier on the surface but its impact as a % loss on the portfolio is the same. Put another way, 156 point drop today would not even be a 1% drop…

  3. When thinking about what to do when turbulence sets in, participants MUST think about their personal timelines for their money. In most cases, for someone 50 years or younger, you’ll have 15+ working/investing years before retirement. During those 15 years you get the benefit of being able to buy into the market as it declines. Ultimately, without having to think about it, you are buying lower with the hope that the shares you are purchasing NOW will be worth more in the future. For those nearing retirement, the question about what to do is a bit more complex. At or near retirement making sure you have adequate cash and safe investments to cover living expenses is everything. Having several years worth of living expenses put aside in CD’s, cash, or money markets makes a ton of sense. This enables you to hold onto the stock or equity investments you have until the turbulence subsides.

  4. Managing your emotions during the turbulence is wise. Much like unbuckling your seatbelt and walking around the cabin during a rough flight, making snap decisions about your 401k during turbulent times can be dangerous to your financial future. Again, although it does NOT feel good when the market(s) get choppy, acting prudently and slowing down can greatly benefit you and your retirement funds. One of the many benefits of being a Human Investing 401k client is access to our 8am-5pm Monday to Friday call in line. One of our advisors can walk you through all your options as well as give you advice based on your specific account. In the end, whatever you opt to do, your decision will be well thought out, informed and discussed.

There are many important lessons we’ve learned from the past. This note is intended to take those lessons and to provide you with some perspective and thoughts on how you might want to approach volatility in your account. In the end, if you have questions and want to talk it over with one of our advisors, please call us as we would be happy to hear from you.


Related Articles