Charts of the Year 2022
These are some of our favorite charts and graphs that told the biggest stories from 2022.
Stock Market Performance
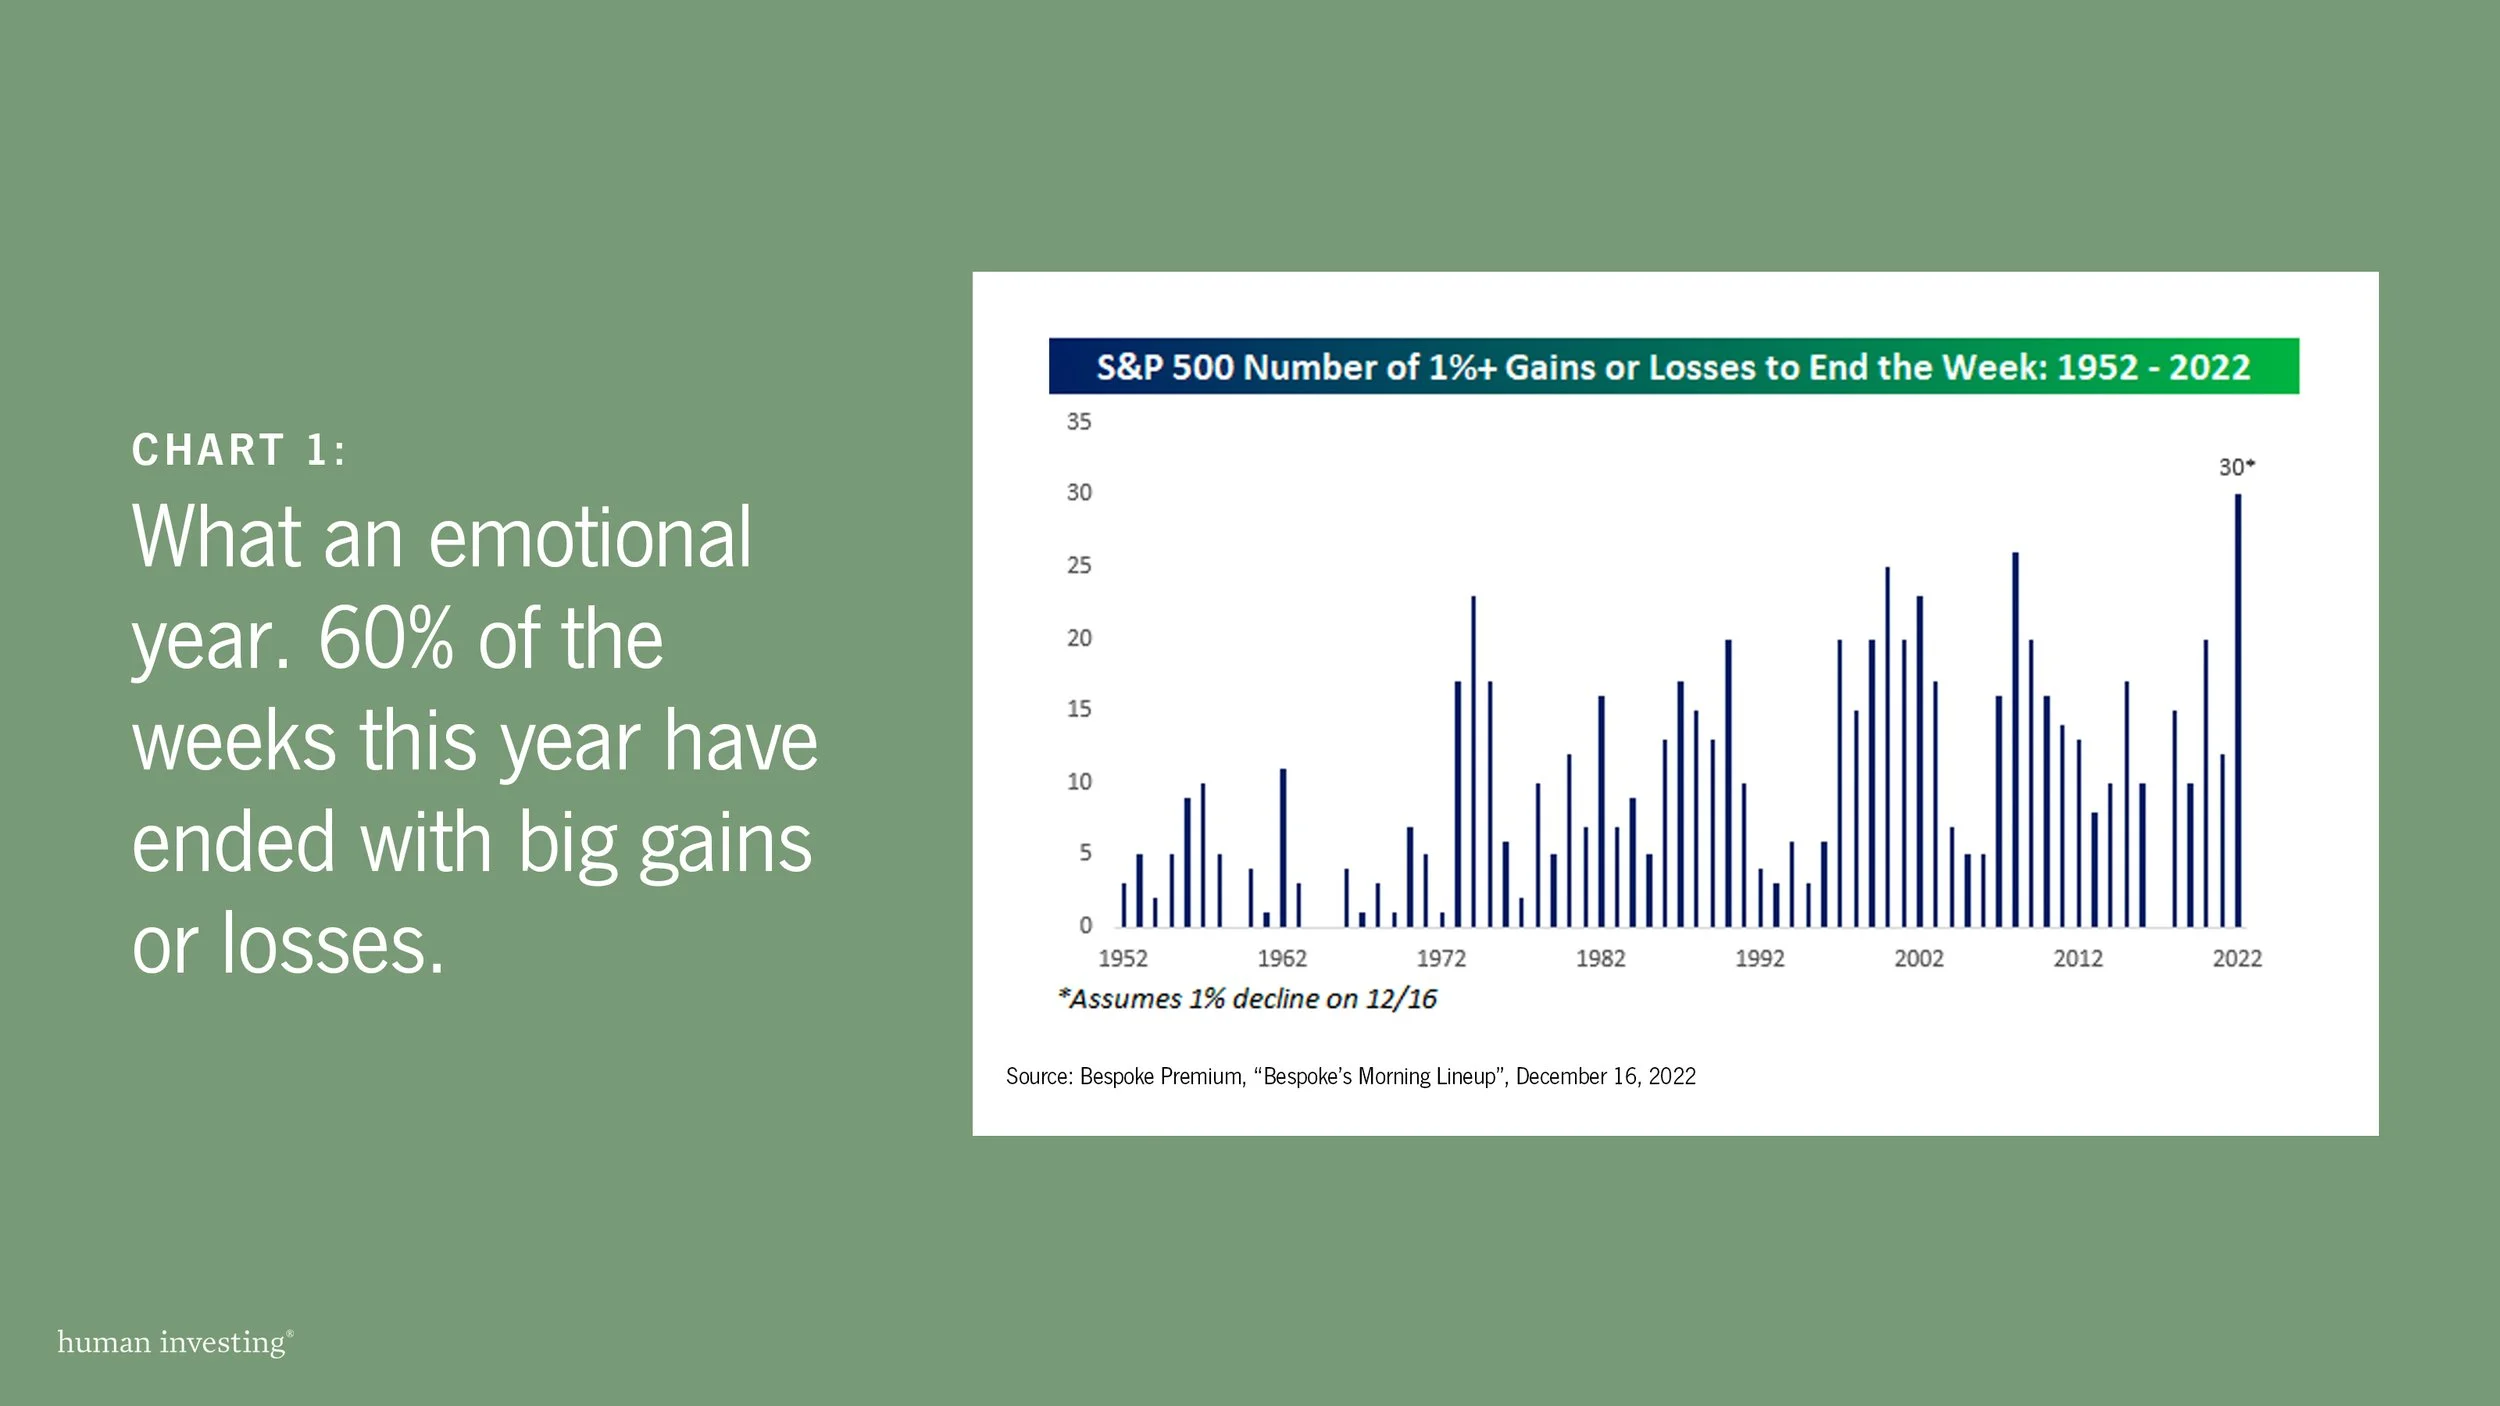

Each year, the stock market has its narrative around why it performed the way it did. With 2022 coming to a close and, as of 12/21, the stock market down 17.31%, one of the narratives for this year has been persistent volatility. As the chart above shows, 2022 marks the most days (30) that the market was either up or down 1%at the end of the week. 16 of the instances were down days, and 14 of the instances were positive.
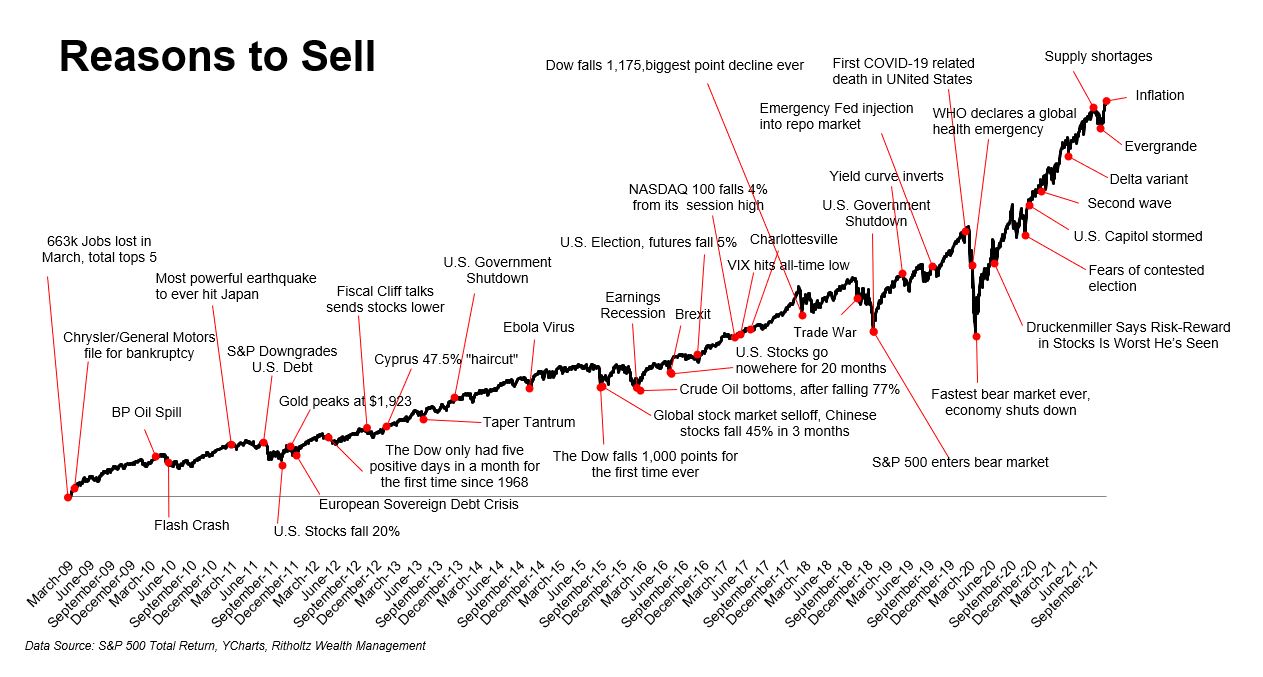
In terms of additional narratives for this year, our team has been referencing a year like 2022 as a “price of admission” year. In other words, to receive the benefit of long-term equity returns, negative years (like 2022) are part of the price of admission to achieve the benefits. We reference this chart when looking at the negative headlines the market has overcome over the years.
INFLATION AND SAVINGS
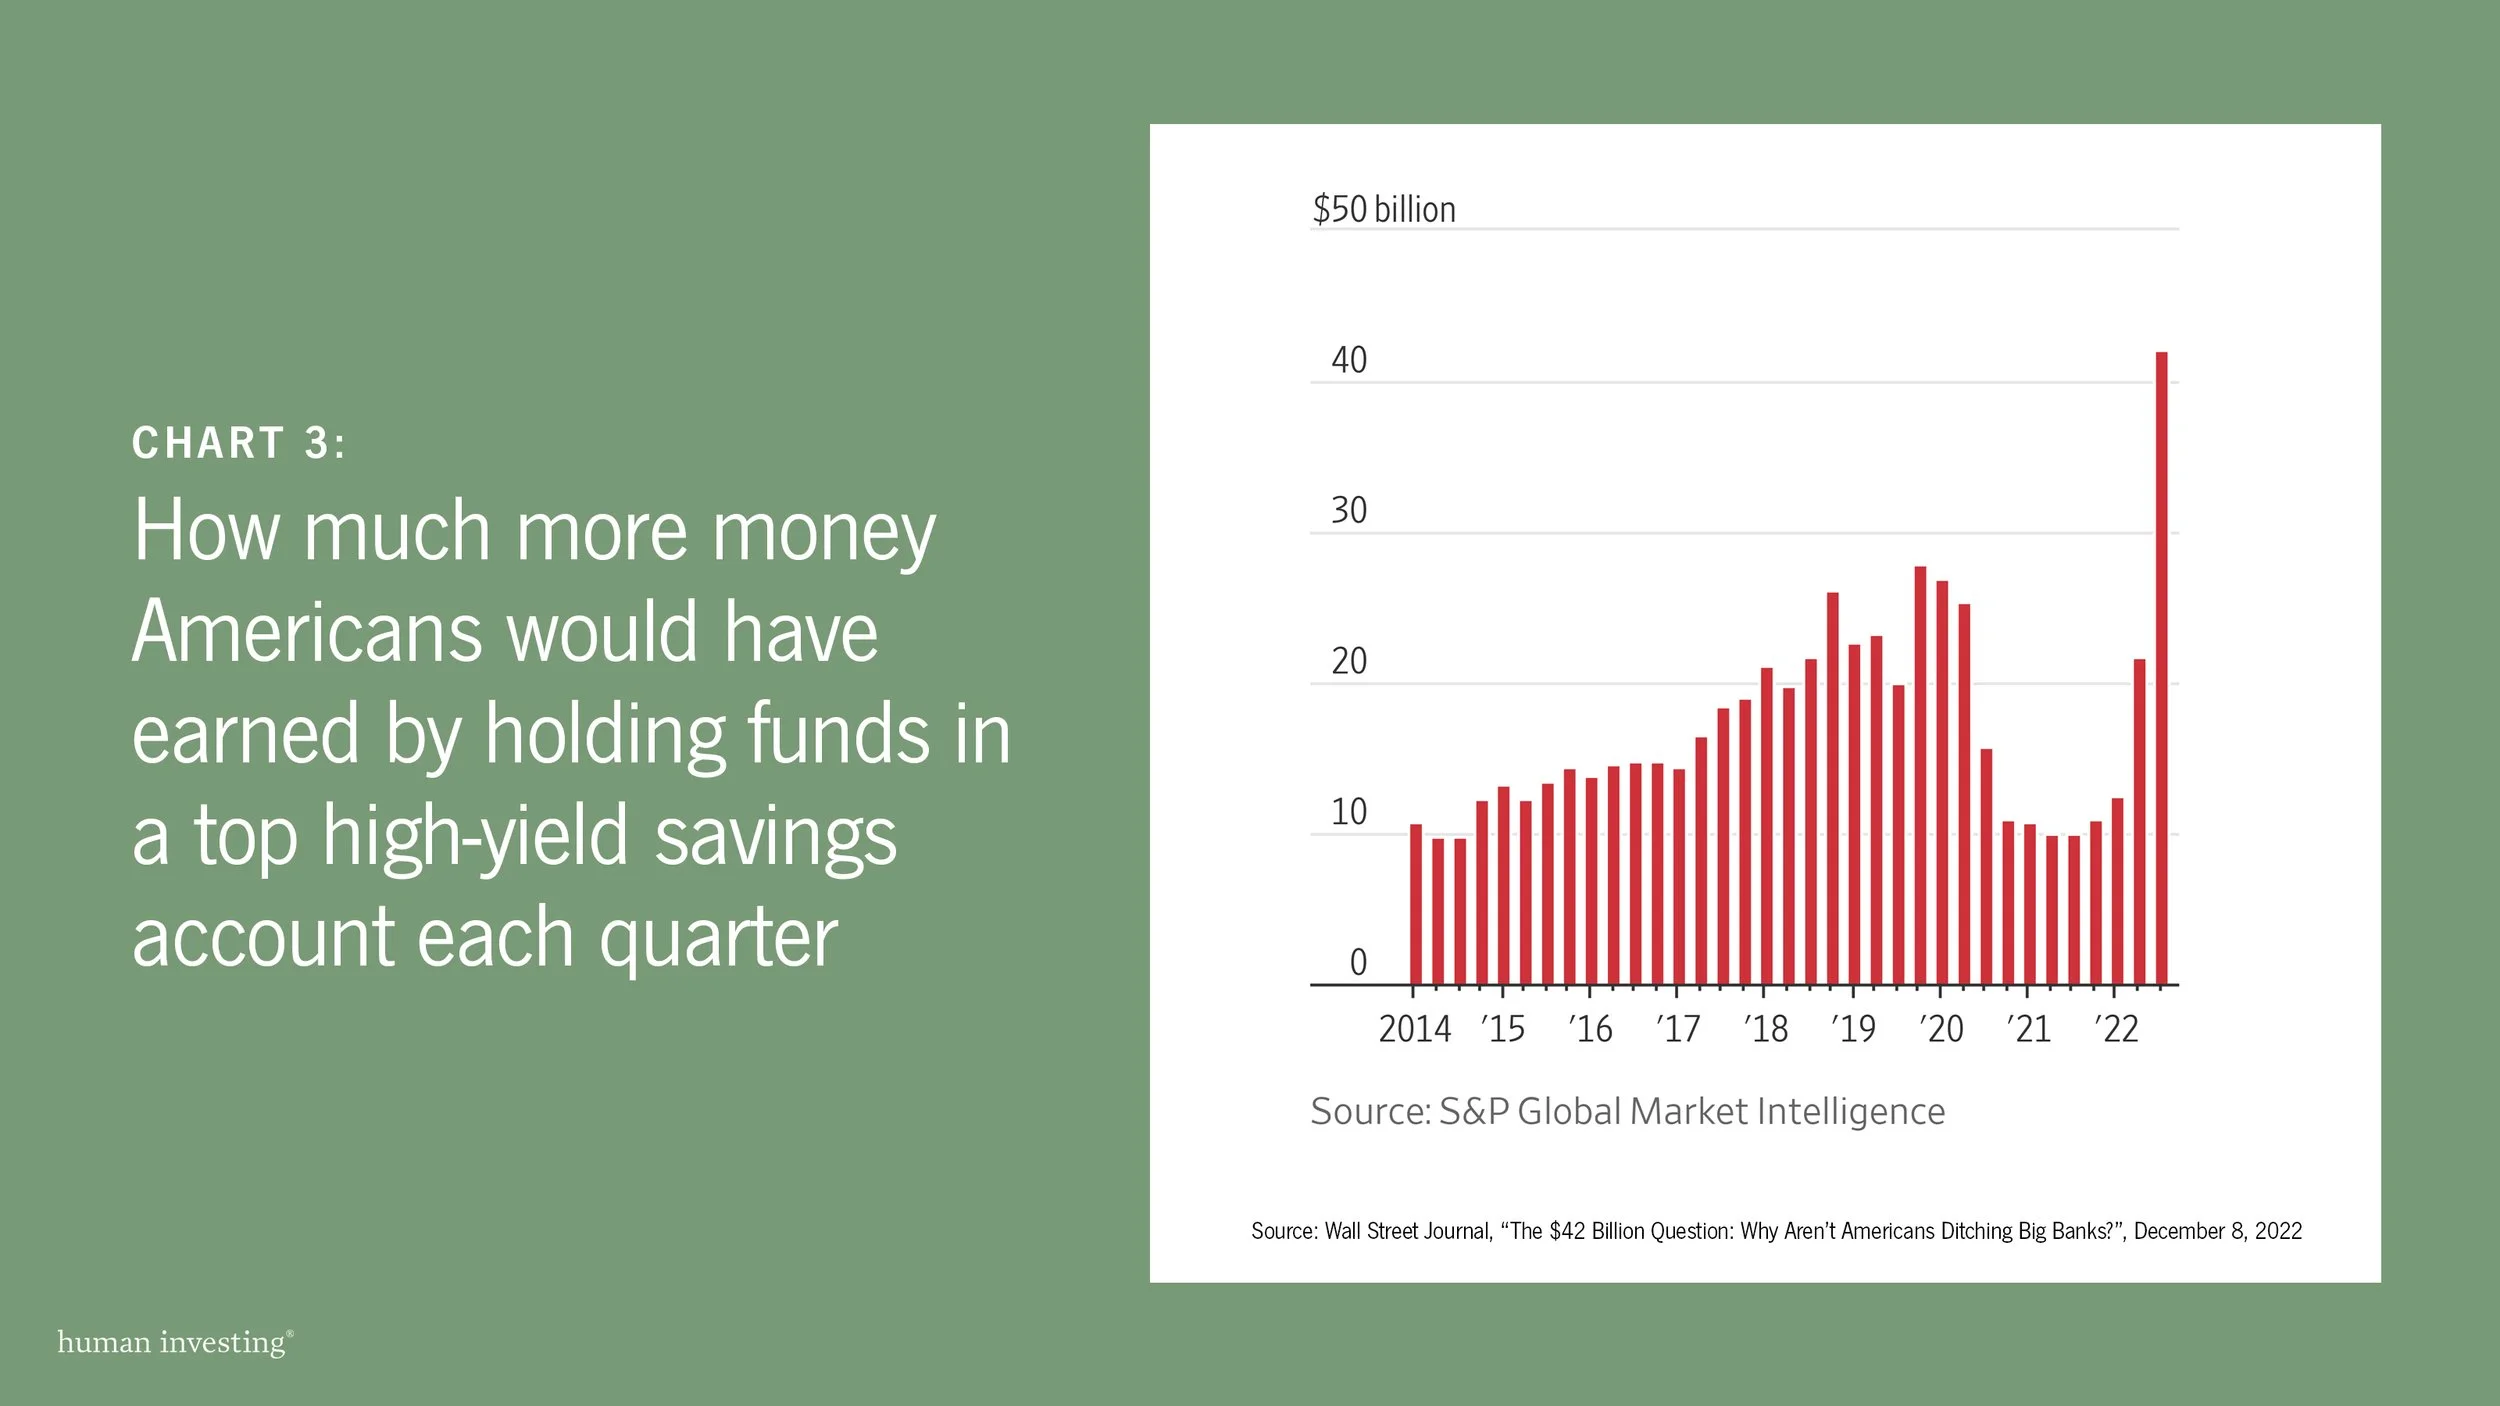

With interest rates increasing rapidly, there have been many moving parts in all areas of the economy. From real estate to food prices, most industries have been impacted. One area that consumers/investors should look to take advantage of is their saving and checking accounts. During the most recent period of low-interest rates, we have become accustomed to these accounts paying little to nothing in interest. However, as the chart above mentions, Americans are leaving dollars on the table by not searching out higher interest bank accounts. Our team recommends utilizing a local credit union which often has new member checking benefits, or aggregator sites like NerdWallet do a good job of providing high-paying savings accounts.
Market Volatility

With all the market downturns and volatility, we thought it would be interesting to see how long it takes to make your money back, depending on how you are invested. Ensuring your allocations are positioned so you can ride out any downturns is essential for any investor.
Job Market

It's been a unique time in the jobs market. Job openings have exceeded people searching for jobs by nearly 5 million for 2022. The persistence of this even with all the uncertainty around the economy and inflation is surprising. As a result of the pandemic, more people are seeking remote work. LinkedIn revealed that remote jobs, which take up 15.9% of job listings, attract 52.9% of job applicants.
FTX
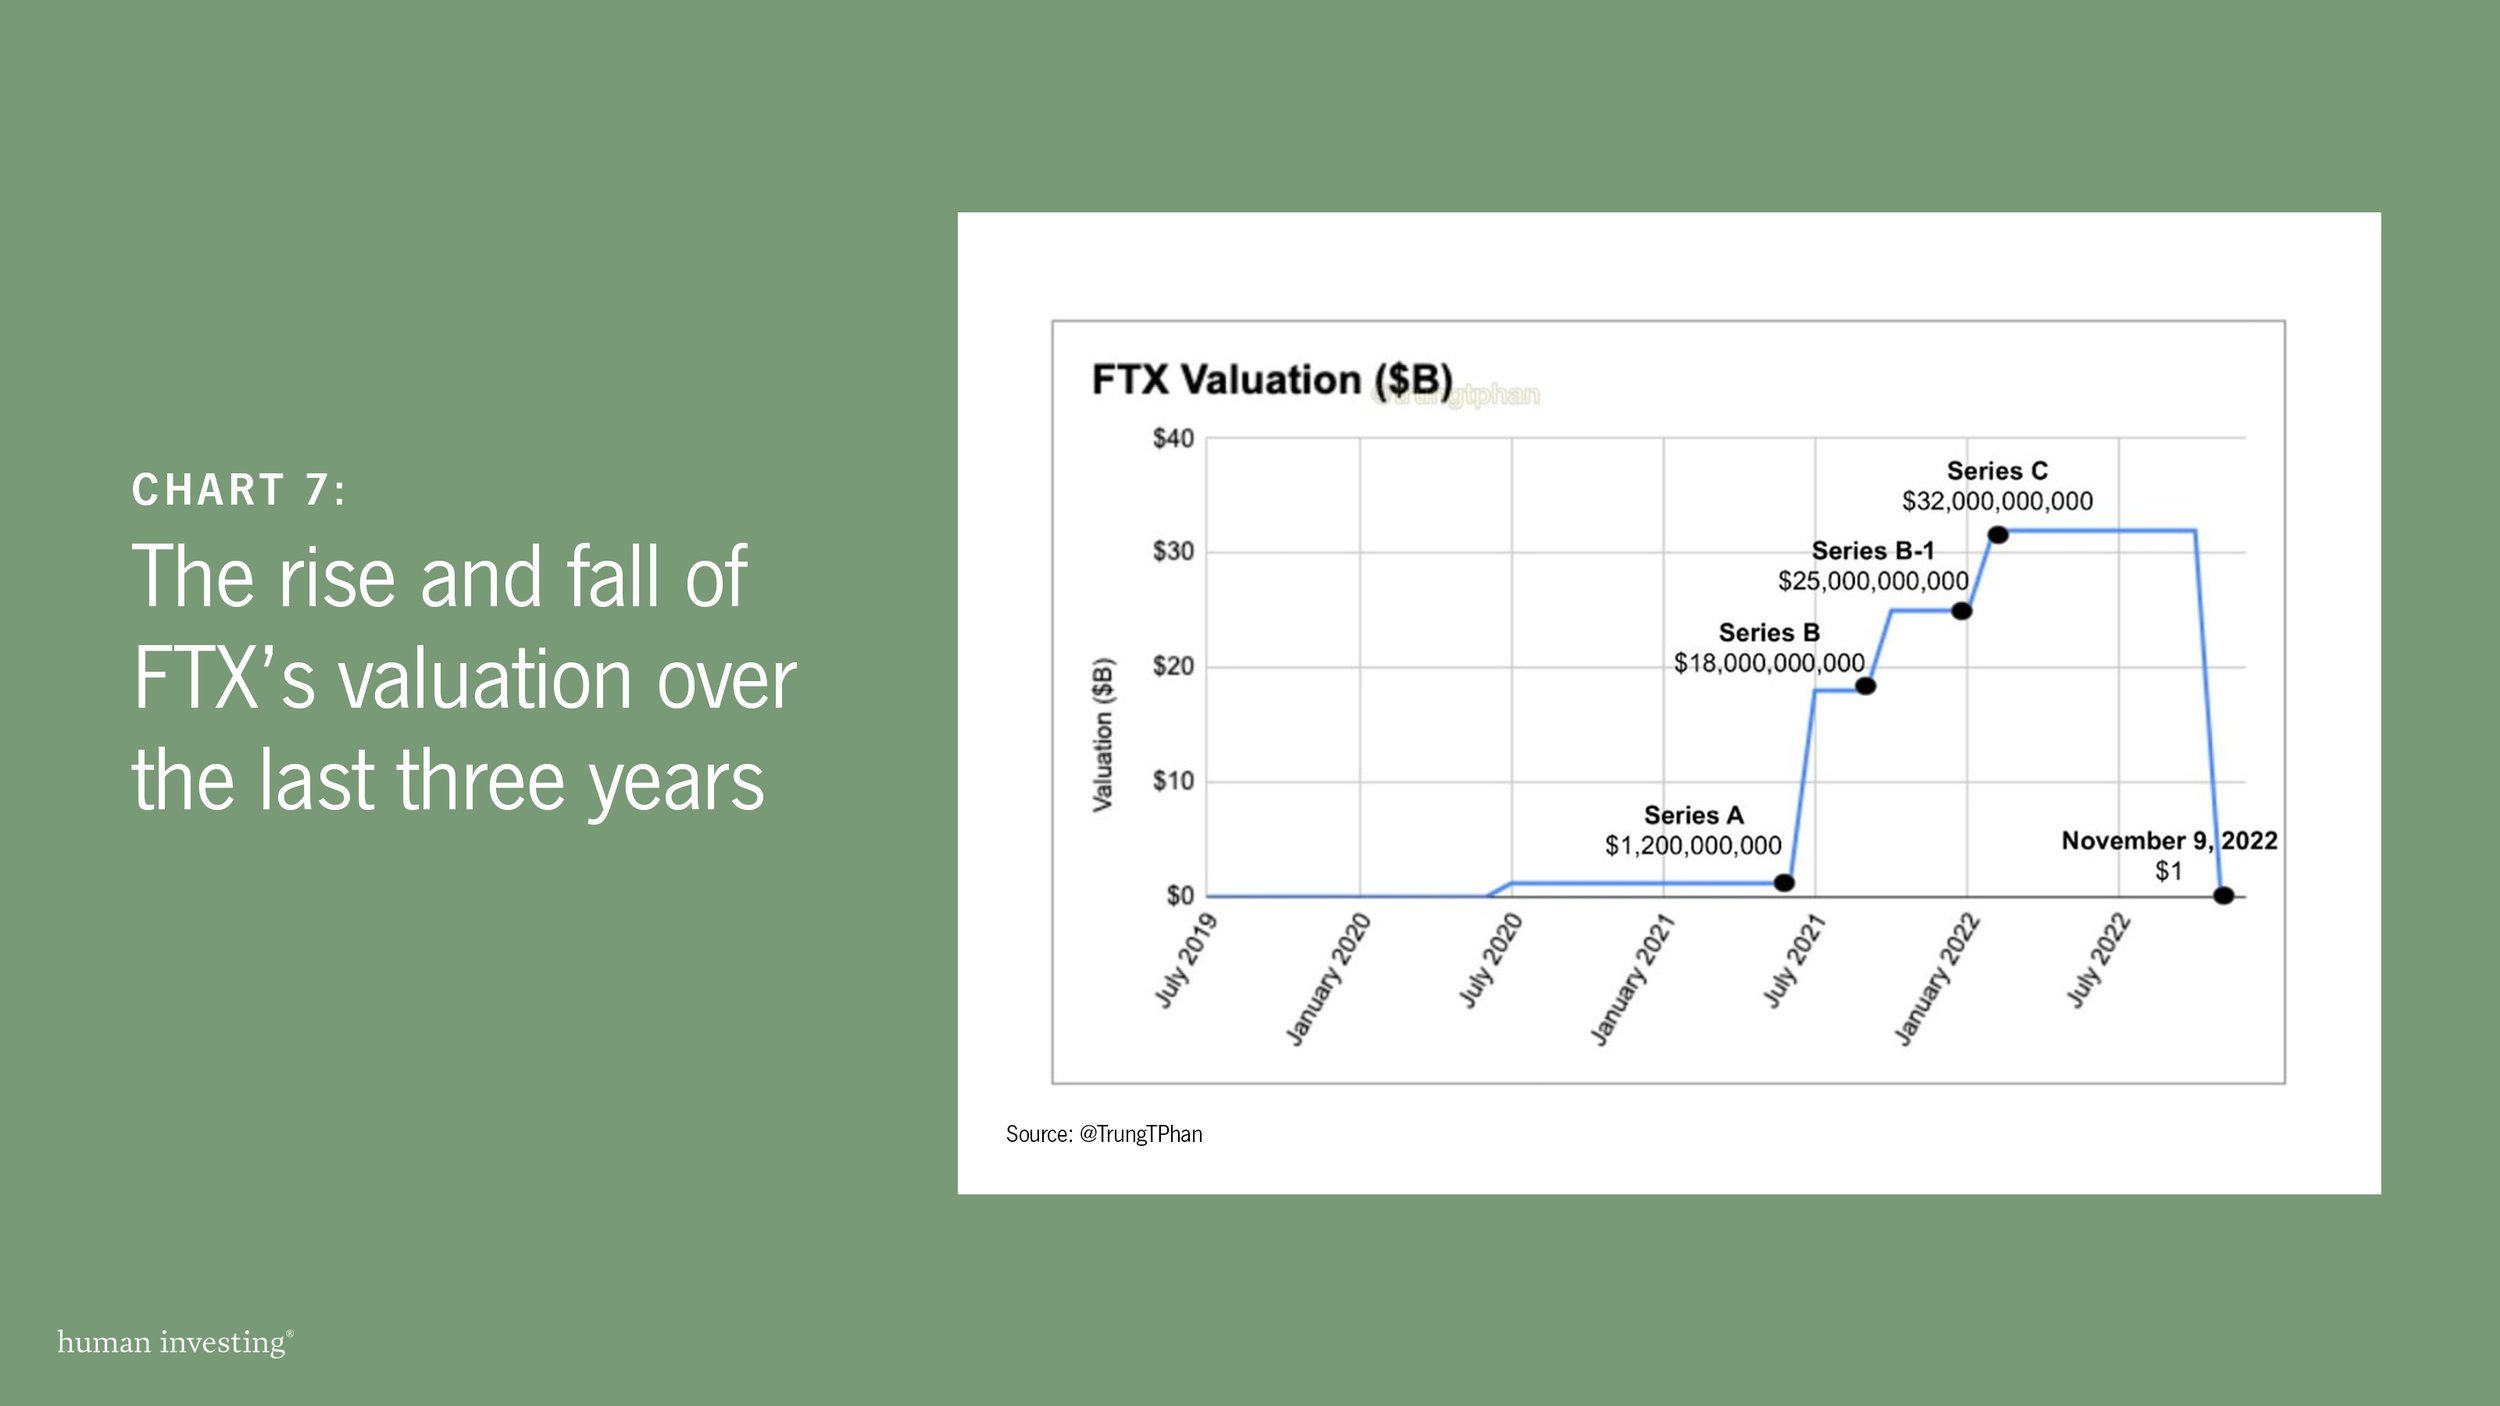
2022 charts of the year wouldn’t be complete without referencing the rise and fall of the cryptocurrency exchange FTX. Even as I write this, new information surrounding this saga continues to emerge, and it will be a high-profile news story to follow into 2023.
The above chart shows how the organization’s value got as high as $32B as recently as January 2022 during FTX’s most recent round of funding. There are many lessons to be learned from fraud scenarios, and like you, we will follow this story into the new year.

Related Articles