Posts tagged market trends and news
Q2 2024 Market Note: Preparing for the Presidential Elections & Fed Policy


Between Fed Policy and the Presidential election, 2024 has all the makings to derail investors. While these factors introduce volatility and uncertainty, historical insights and a sound financial plan can guide those navigating the financial markets.

The year began promisingly, with the market reaching all-time highs in the first quarter of 2024. However, the start of the second quarter has highlighted the inherent unpredictability of the financial landscape. Beneath these surface-level fluctuations lies a geopolitical landscape marked by pivotal events that demand attention.

Fed policies will continue to impact market dynamics

The Federal Reserve's stance on interest rates emerges as a significant factor shaping market sentiment and performance in 2024. Speculation about potential adjustments in interest rates can significantly influence investor behavior and market dynamics. Lower interest rates can stimulate economic activity and boost equity valuations. However, uncertainties surrounding the timing and magnitude of such policy shifts add complexity to the investment landscape. At the beginning of the year, the Fed indicated it might cut rates at some point in 2024. But with inflation remaining higher than expected, it's now anticipated that there will be fewer rate cuts (if any) than initially predicted.

The "cost of admission": lessons from decades of market turbulence

Regardless of the headlines, it's fundamental to understand that the path to stock market growth is paved with bumps in the road. The following chart from JP Morgan nicely illustrates how volatile the stock market can be over short periods of time. In the chart, grey bars represent the returns for each calendar year, while red dots show the intra-year declines.

Looking back to 1980, the S&P 500 experienced an average sell-off of 14.2%, while ending positive in 33 of the 44 years measured. This inherent market fluctuation underscores the “cost of admission” for those seeking long-term gains through stock investments.


Insights from past elections: market performance amid political uncertainty

In most years, the stock market experiences growth, and this pattern holds true for presidential election years as well. However, investors should be prepared for increased volatility due to market uncertainty. Over the past four decades, election years have witnessed heightened market volatility fueled by the ambiguity surrounding political transitions. Despite this turbulence, historical data illustrates the market's resilience.

The S&P 500 has delivered a median total return of 11% over the past ten election cycles, inclusive of the 2008 Global Financial crisis. Though slightly lower than the median return of 15% across all years since 1984, this resilience showcases the market's ability to weather political flux.

Despite the uncertainty surrounding elections, historical data indicates that remaining invested through the election has proven advantageous. Once election results are announced, returns often speed up, usually boosting equity valuations and prices post-Election Day regardless of election outcome.

Leveraging a well-crafted plan for stability

During market turbulence driven by factors such as Federal Reserve policies and elections, a well-crafted financial plan acts as a stabilizing force. As we journey through 2024, it's essential to acknowledge that fluctuations are inherent in investing. Stress-testing your financial plan against various scenarios becomes vital, providing resilience in the face of uncertainty. While headlines may evoke strong emotions, maintaining a long-term perspective grounded in a robust plan aids in navigating choppy waters.

As 2024 unfolds, investors are reminded to stay committed to their financial plan's principles. By drawing on historical insights and adhering to a clearly defined strategy, investors can confidently maneuver through market volatility, knowing that their financial plan serves as their guiding star, directing them toward their long-term objectives.

Sources

  1. Human Investing. (2024). 2024 Q1 Economic Update: Politics and the Market. Human Investing Blog. Retrieved from https://www.humaninvesting.com/450-journal/q1-2024-economic-update

  2. Goldman Sachs. (2024, February 1). Global Macro Research. Retrieved from [https://www.goldmansachs.com/intelligence/pages/2024-the-year-of-elections-f/report.pdf]

  3. J.P. Morgan. (2024). Guide to the markets: March 31, 2024.


Related Articles

2024 Q1 Economic Update: Politics and the Market


Welcome to 2024

It’s an election year and America will vote in November for a new Congress and President. Regardless of the election outcome, some investors will be pleased, while others will be disappointed. This article will help investors understand how the markets have been influenced when different political parties take control of both Congress and the Presidency. Looking at data from 1926 through 2023, the main conclusion is straightforward:

Over time the markets tend to rise, regardless of which party controls the White House or Congress.[1]

What impact does the President have on the stock market?

Democratic presidents have overseen slightly higher stock returns compared to Republicans. However, this difference is minor and not considered statistically significant. The variance in stock returns under different political parties can be attributed to the random chance of who happened to be in power at a given time. The reality is the US economy is vast and intricate, making it challenging for any individual, even a powerful figure like the President, to completely control its direction.

A recent example is the presidential election of 2016. The general expectation was for Hillary Clinton to win. When Donald Trump unexpectedly secured victory, initial market reactions led to a decline. By the following day’s market close, markets had not only recovered from the dip but ended up positive on the day. It’s hard to know how the market will respond to unexpected information, and it’s equally difficult to predict what impact a President may have on the stock market.

What impact does Congress have on the stock market?

On the other end of the federal government, a Republican-controlled Congress has typically overseen the best stock market returns. The differences are minor enough that there’s no certainty which party controlling congress (or a split) is best for the stock market.

Congress can be the more impactful part of the federal government in the long run. Executive actions are easily overridden day one by a President from the opposing party taking office. Legislation tends to be more enduring due to the requirement for a larger number of people to be involved. It’s important to note that the effects of legislation may take years to become apparent. This time lag makes it extremely challenging to pinpoint and attribute specific policies to their respective impacts on the ever-evolving dynamics of the market.

What about the White House and Congress combined?

When you widen your lens to encompass both the White House and Congress, the narrative remains consistent. Markets tend to go up irrespective of political control.

Regardless of the federal government’s control scenario, markets go up more often than they go down

As the 2024 elections unfold, we urge investors to remember that investing is a marathon, not a sprint. Position your portfolio to be successful in the long run, enabling it to weather unexpected changes from any source. Both parties have experienced periods of positive and negative returns while in power. Despite the inevitable changes in government, companies exhibit resilience and innovation, consistently discovering avenues to yield returns for their investors. In the intricate dance of politics and markets, a steadfast and forward-looking investment approach proves to be the key to enduring success.

Sources:

[1] Equity returns are monthly returns for the Ibbotson SBBI US Large-Cap Stocks Total Return for Jan 1926 thru Oct 1989 (data courtesy of the CFA Institute & Morningstar Direct), and the S&P 500 Total return for Nov 1989 thru Dec 2023 (data courtesy of YCharts)

Data for which party controlled both houses of Congress and the presidency is from the history.house.gov website (https://history.house.gov/Institution/Presidents-Coinciding/Party-Government/)

Changes to Congress and the Presidency are assumed to occur Jan 1st of odd years. A split Congress indicates that each party controls either the House or Senate, but neither party controls both.

Appendix: Bonus Chart 📈


Related Articles

2023 Q4 Economic Update: Labor’s impact on the economy


In recent months, I’ve been pondering the US labor force and how it has changed in the last five years. Amid the ongoing conversations surrounding inflation and the Federal Reserve's (aka The Fed) recent decisions to raise interest rates to manage inflation, I don’t want to neglect the other part of The Fed’s dual mandate: the dynamics of unemployment and the labor force. Prior to COVID-19, unemployment was at 3.5%, the lowest rate in the last 50 years. Today unemployment is around 3.8%, and has been 4% or lower since December 2021, significantly below the median unemployment of approximately 5% the US has experienced over the last 25 years. Since March 2021, job openings have consistently surpassed the number of job seekers.

Unemployment is often considered an indicator of an economy’s health. Like inflation, you want some unemployment, but not too much. Too high unemployment indicates a weak economy. If unemployment is too low, high inflation becomes a concern. Businesses seeking to grow may be constrained because of a lack of workers, limiting overall economic growth.

Strong employment is a major reason why 2023 has not experienced the recession that many feared at the beginning of the year. I wanted to delve into the reasons behind the tight labor market, what can be done about it, and what this signifies for the overall economy.

Labor’s impact on the current economy

The fundamental assumption in most economic models is that production is constrained by two primary inputs: labor (i.e. workers) and capital (i.e. technology). While technology has yielded significant advances in productivity, the necessity for a workforce to drive economic growth remains. A shortage of labor would imply slower economic growth, potentially resulting in reduced stock market growth.

Concerns persist regarding automation displacing jobs. Some have even proposed the implementation of a universal basic income due to the scarcity of employment opportunities resulting from automation (as exemplified by former presidential candidate Andrew Yang, who made this a central theme of his campaign). A variation of this concern has been present for over a century.

The latest development in automation centers around AI potentially increasing productivity to the extent that we might encounter a surplus of labor. Numerous case studies illustrate that technological change does not always materialize as successfully or rapidly as initially projected. A decade ago, there was much buzz about how autonomous cars were poised to revolutionize the world. Substantial progress has been made, but the challenge of perfecting driverless cars has proven more intricate than many had anticipated. (An example is Moral Machine, where you weigh in on how a self-driving car should navigate situations where the car must choose who to protect in an unavoidable collision).

Another illustration can be found in the excessive optimism at the peak of the dot-com bubble. While the internet did transform the way we work and introduced new efficiencies, it took significantly longer than what people in 1999 had envisioned. Forecasting the timeline for technological change impacting worker productivity is challenging.

If I had to guess, I would anticipate that in the near term (i.e. the next 5 years), we will continue to experience a tight labor market that will be a headwind to growth, for the economy and the stock market.

Retiring baby boomers present a significant challenge

By 2030, the youngest Baby Boomers will turn 65. The average American retires at 64. These retiring Baby Boomers possess the most expertise and would ideally be succeeded by Gen X workers with slightly less experience. However, Gen X is too small of a generation to fully replace the baby boomers, and Millennials & Gen Z broadly lack the experience necessary to fully replace the skills of retiring baby boomers.

This is backed by recent projections by the Bureau of Labor Statistics (BLS), showing that total employment is expected to grow by only 0.3% annually for the next decade, with a significant constraint being the slower growth of the working age population. Slowing growth in labor likely means slowing growth in GDP and stock prices.

Furthermore, there has been a consistent decline in the labor force participation rate over time. This is a measure of everyone 16 and older who is not in the military or an institution (due to criminal activity, mental health, or aging). Part of this reflects the aging population. As the proportion of the population beyond retirement age increases, a smaller segment of the population remains in the workforce.


How can we increase labor?

Gen Z is entering the workforce, but as a generation, they are too small to completely replace retiring baby boomers. Producing more working-age adults takes at least 16 years and 9 months, and the US birthrate has been below the stable replacement level of 2.1 for most of the last 50 years. If the US wants to sustain long-term population growth, and consequently, workforce expansion, it must either depend on immigration or find ways to boost the birth rate.

Implementing a policy permitting increased immigration could boost the size of the workforce in America. However, this is a politically contentious issue, and the legal framework around immigration is too uncertain to make reliable long-term predictions. Overly restrictive immigration policy could lead to a labor shortage, and too permissive immigration policy could cause a labor surplus. Foreign workers constitute approximately 20% of the US workforce.

A tighter labor market has some benefits for workers

The scarcity of labor translates into more choices when seeking employment and enhances the bargaining power of job seekers. Companies will have to consider their recruitment and retention policies to ensure they have the workers required for optimal performance. US wages and salaries are remaining above inflation, showing workers ability to demand higher compensation.

A tighter labor market plus higher wages could equal higher inflation rates

However, higher wages also entail increased costs for companies, and the allocation of these costs, whether to customers or shareholders, may result in higher inflation or reduced earnings. To counter inflation, the Federal Reserve has been increasing and maintaining higher interest rates. Many are apprehensive that the tight labor market (associated with demand-pull inflation) and ongoing post-COVID supply chain challenges (linked to cost-push inflation) could make achieving the long-term target of 2% inflation more challenging.

In Q3 2023 we observed inflation rates increasing from just below 3% in June to 3.7% in September. Many consider unemployment and inflation to have an inverse relationship. A tighter labor market may necessitate the Federal Reserve to persist with a more extended and aggressive tightening policy to manage inflation. If the Federal Reserve becomes overly aggressive in its tightening efforts, the concerns that led many to anticipate a 2023 recession could materialize.

All of this hinges on the tight labor market persisting. Technological advancements have the potential to enhance productivity to a level where a smaller workforce can achieve more and sustain economic growth. Modifications in immigration policy could either introduce a new source of workers or further reduce the size of the workforce.

In the long run, successful companies will adapt to the new environment and thrive. A diversified portfolio will continue to capture the growth of the companies that excel. We encourage investors to be prepared for a myriad of reasons to be nervous, and understand given time the market will figure things out and continue to grow.


Related Articles

2023 Q3 Economic Update: What’s behind the market rally


What recession?

As prognosticators assessed markets and the economy in the beginning of 2023, the expectation for many was a tumultuous year,  with a substantial likelihood of a recession. Now, nearly two-thirds of the way through the year, the S&P (Standard & Poor) 500 has surged by 18.73% through the end of August. Real GDP (Gross domestic product) has maintained steady growth, with quarterly increases of at least 2% since Q3 2022. Inflation, which began the year at a daunting 6.4%, has receded to 3.18%, still above The Fed's 2% long-term target but showing a marked improvement.

What changed given the gloomy expectations for 2023 at the start of the year? The biggest unknown was the impact of The Fed’s decision to continue raising interest rates. The expectation was that The Fed raising interest rates to cool inflation would cause an economic recession. We’ve even seen rising rates play a role in multiple banks failing earlier in 2023, but those events haven’t triggered any distress.

We’ll break down the top themes for why we’re seeing the markets and economy continue to power through.

Theme #1: Strong job market

Inflation has gone down, but GDP growth remains positive, and unemployment remains low. There are still 3 million more job openings than job seekers, and few were expecting The Fed to get this far on inflation without dipping the economy into a recession. Even experts have a difficult time accurately predicting where the markets and the economy are going.

Theme #2: ‘Soft landing’ of interest rate hikes

In contrast to the substantial interest rate hikes witnessed in 2022, the changes in 2023 have been modest. A significant contributor to the slowdown in interest rate hikes was the decline in inflation during the latter part of 2022, which has persisted into 2023. Consequently, The Fed didn’t need to enact as many rate increases, or do so as rapidly as they did in 2022.

Theme #3: Surprising growth from S&P 500 companies

The S&P 500’s rise has a couple of factors going for it. While 2022 saw a decline in earnings per share for S&P 500 companies, 2023 has witnessed earnings growth, with expectations that growth will continue. Analysts are feeling increasingly optimistic that companies will find a way to bolster earnings amidst a higher interest rate environment.

The other piece of the puzzle is the exceptional performance of the largest stocks within the S&P 500 this year. The S&P 500 is a market cap weighted index, meaning that each stock is weighted based on how large the company is. This means AAPL has a bigger weight than Home Depot, and AAPL being up 10% would increase the S&P 500 performance more than HD (Home Depot) being up 10%.

In 2023, returns have been concentrated in a few high-performing stocks. Put differently, only 28% of stocks in the S&P 500 have outperformed the index. This highlights the dominance of a handful of top performers in 2023. It’s worth noting 61% of stocks in the S&P 500 have achieved positive returns for the year, indicating favorable performance across the stock market.

Source: Data for this paragraph is based on using IVV (iShares Core S&P 500 ETF) holdings. Positions were all verified to be held 12/30/2022 and 8/24/2023 to ensure consistency of constituents. Average returns assumes equal weighting of the positions. Top 10 holdings are based on 8/24/2023 weighting: AAPL, MSFT, AMZN, NVDA, GOOGL, GOOG, META, BRK.B, TSLA, UNH. Jan-Aug performance data courtesy of YCharts as of 8/31/2023 market close.

Theme #4: Mid and small sized companies are not far behind

Many talk about the S&P 500 as though it represents the entire stock market. However the S&P 500 represents the largest companies in the US (typically $14.5 billion and greater), leaving out companies considered mid-sized and small.  The mid and small parts of the US markets have been lagging, still positive returns but not as high.

Source: All data courtesy of YCharts. Assumes S&P 500 for US Large, S&P 400 for Mid, S&P 600 for Small, and S&P 1500 for Total Market (blend for all). Uses Value & Growth versions of benchmarks respectively.

Predicting short-term MARKET outcomes continues to be difficult

Short-term value oriented investors may be frustrated to see their performance lagging the broad market. Alternatively, longer-term investors recall seeing a significant benefit in 2022 by experiencing less negative returns than the broad market or growth stocks. You are still positive from the start of 2022 to the end of August 2023. Growth and blend investors are still waiting to recover from the downturn. Trying to time when value or growth will outperform is not recommended. Find an investment style that suits your risk tolerance and financial plan, and be prepared to stick with it for the long haul despite periods of under or over performance.

The year 2023 so far serves as a compelling illustration of how stocks can still generate positive returns even in the face of grim expectations. It is also a great reminder of how difficult accurately predicting the economy or the markets is. The outlook for the equities market is rarely all sunshine and rainbows. Stock market volatility means that short-term corrections are always on the table. There are and always will be valid concerns that could lead to a downturn. If you are choosing a particular tilt in your investments, be prepared to stick with it over time. Long term, equities remain the best way to grow your savings. It is valuable to remember and reflect on the times when you anticipated poor returns but were pleasantly surprised by positive performance.


Related Articles

Economic Update From Human Investing: Yield Curves


What is the yield curve?

The yield curve refers to the current yields of US treasury bonds based upon time until maturity. It’s frequently depicted as a graph to help summarize the data. Typically, a yield curve is upward sloping. Short-term (ST) rates are lower, and long-term (LT) rates are higher.

Wall Street Journal, Bonds & Rates: Yield Curve, April 25, 2023

Reading the yield curve:

  • A “steeper” or “steepening” of the yield curve means short-term (ST) rates are lower, and long-term (LT) rates are higher, resulting in a steeper line when comparing

  • A “flatter” or “flattening” of the yield curve is when ST rates and LT rates are equivalent, or are getting closer to parity

  • An “inverted” yield curve is when ST rates are higher than LT rates, like the current line in the snapshot above.

What determines the yield curve?

All rates on the yield curve are determined by the market. The Fed only controls the federal funds rate, which is only the rate banks lend to each other overnight. Because the market determines the shape of the yield curve, many look to the yield curve as a summary of overall investor sentiment to draw conclusions about expectations for the future. Some important market factors that influence the yield curve include:

  • Liquidity (time horizon): The more time until a bond matures, the longer you have your money tied up. As a result, a longer time to maturity (and lower liquidity) bond tends to have a higher yield. This contributes to an upward sloping yield curve.

  • Growth expectations: If there are higher growth expectations, you tend to see a steeper yield curve. This is because higher growth tends to lead to higher inflation, and so rates must be higher to achieve positive real returns.

  • Demand: As more investors demand a bond, the price goes up. As bond prices go up, yields go down.

Why is the yield curve inverted, and why does that indicate a recession?

The yield curve is inverted because ST rates are higher than LT rates. This is largely due to The Fed raising interest rates to lower inflation. The Fed appears determined to reign in inflation, and has raised ST interest rates to slow down the economy enough to reduce inflation. This is putting upward pressure on ST rates. Many expect this approach to cause a recession, which would lower growth expectations, reducing LT interest rates. The result is the inverted yield curve we see today.

Why does this inversion indicate a recession?

In theory, the market is pricing treasuries so the returns over a given time period are the same, regardless of what you buy today. Let’s use an example to illustrate this.

Say you want to invest $10,000 in treasuries for 2 years, you can make two choices:

  1. Choice #1: Buy a single 2 year treasury

    • Currently a ~4.2% yield, so you earn roughly 4.2% for 2 years.

  2. Choice #2: Buy a 1 year treasury today, then a new 1 year treasury in 1 year:

    • Currently a ~4.7% yield, so you earn roughly 4.7% for 1 year.

    • After the first year, your treasury will mature, and you will have to purchase a new treasury at whatever the current rates are. The yield curve today is predicting 1 year rates will be at 3.7% in the following year.

    • Your overall return after averaging those rates for each year is 4.2% — the same as buying a 2 year treasury initially!

A lower rate in the future indicates lower growth expectations at that time. Growth expectations being lower (or negative) does not bode well for the health of the economy. The inverted yield curve also has a solid record of predicting recessions, but that doesn’t mean it’s perfect or guaranteed. The yield curve reflects the average sentiment of the markets, which indicates what expectations are. Sometimes expectations create a self-fulfilling prophecy situation, and sometimes expectations are flat out incorrect because of an unexpected shock, like the COVID-19 pandemic.

What does this mean for me and my portfolio?

Ultimately your portfolio should be allocated for the long term, and that should be positioned accordingly. While the inverted yield curve has been a strong predictor of recessions, the timing of that prediction and how significant it’s going to be are not consistent enough to provide an easy 5 step solution for everyone.

If you are positioned towards the more aggressive end of what you are comfortable with, consider reducing risk with some volatility expected on the horizon. Understand that regardless of the yield curve today, the long run expectation is growth and positive returns for the economy and equity markets.


Related Articles

Economic Update from Human Investing
 

As a Charted Financial Analyst serving as the firm’s Director of Investments and Compliance, I oversee the construction and management of client portfolios. How we go about investing client capital involves evaluating a variety of factors that move the markets. Given the economic backdrop for 2022, I thought it would be helpful to address a few of the components impacting the economy and subsequent stock and bond market volatility.

Historical trends suggest the current high levels of inflation will not persist.

 Inflation is higher than it has been for decades, exceeding 7.5% in the March to October 2022 numbers, represented in the purple line below. The breakeven rate between a 5-year Treasury Inflation Protected Security (TIPS) and a standard Treasury is commonly used as a benchmark for what average inflation over the next five years is expected to be. The graph below shows this in orange below, hovering around 2.34%.

What is causing inflation?

There are broadly two types of inflation:

1. Demand-pull inflation occurs when there is too much demand for a limited supply of items (too much money chasing too few goods).


2. Cost-push inflation occurs when the costs of inputs for producers increase, and those costs are passed along to consumers (too few inputs to produce too many goods).

Both factors are helping push inflation higher. Government stimulus in response to COVID and global supply chains having to adjust in response to the pandemic have both had their part in increasing inflation, along with many other factors.

What brings inflation down?

Macroeconomic theory believes that inflation falls when an economy slows down. A slower economy usually means higher unemployment and less spending and investment. This means there isn’t too much demand-pull inflation occurring because higher unemployment means there are fewer wages chasing the goods produced. Higher unemployment also tends to lead to lower cost-push inflation because the cost of labor typically goes down when unemployment is high.

The Fed is still working on a soft landing.

Higher inflation is not healthy for an economy long term. Banks still want to make money even when inflation is high, so they lend at higher rates to ensure they still make a profit after accounting for inflation. Higher interest rates result in a higher cost of borrowing, making any investment (buying a house, going to college, launching a new business, building a new production facility, etc.) more expensive. Households and companies invest less, which means fewer productive and good investments happen, slowing down the overall economy.

Because high inflation is unhealthy for an economy, the Federal Reserve (aka “The Fed”, the US central bank) is raising interest rates. The Fed’s goal is to raise interest rates high enough to slow down the economy and bring down inflation. The concern is that The Fed will be too aggressive in raising interest rates and cause a sharp economic downturn. The hope is The Fed can execute a soft landing, slowing down the economy enough to reign in inflation but not slowing down so much to trigger a major recession.

The job market is still experiencing labor scarcity.

Currently, there are about 5 million more open jobs than people looking for a job. Unemployment is below 4%, near the historical lows we were experiencing pre-pandemic. Due to labor scarcity, employees are seeing their wages rise.


The overall economy is seeing consistent growth.

Gross Domestic Product (GDP) is the most used measure of the size of an economy. Real GDP (rGDP) accounts for inflation. The orange line is a “trendline” for real GDP, based on the average growth of rGDP from 2012 to 2017. As you can see, GDP is not far off from what would have been expected if the COVID downturn & recovery had never occurred. While the first half of 2022 had two-quarters of negative GDP growth (a common definition of a recession), Q3 2022 saw the economy grow.


Company earnings are still increasing despite downturns.

The following chart illustrates earnings growth compared to the S&P 500. The market tends is forward-looking, setting prices based on what is expected to happen. Current fears about inflation & The Fed triggering a downturn by raising interest rates too much too quickly are pushing the market down. Earnings reflect what companies earned in the previous three months. While there is a lot of anxiety about the state of the economy, companies are continuing to earn money and will continue to do so even in a downturn.


What does this mean for you and your portfolio?

In conclusion, there are contradictory messages. The economy quickly recovered from the global pandemic, and the workers are enjoying a solid labor market with wages rising. The positive economic news is contrasted with poor investor experience in the stock market. Concerns about high inflation and The Fed’s anticipated aggressive rate hikes to combat inflation have the market worrying about a recession. With all this happening, companies have continued to grow their earnings.

While there is conflicting information in the short term, we continue to anticipate long-term growth in the economy and stock market. Having a sound financial plan that accounts for downturns and uncertainties is crucial. Feel free to reach out if you have any questions about your plan or have had any changes in your financial situation.

All data courtesy of YCharts Nov 29, 2022.


Related Articles

Is Inflation Affecting your Investments?
 

Inflation can lay waste to portfolios and wages, which is one of many reasons why inflation is concerning for laborers and investors alike. Some speculate that the rise in inflation is from supply chain congestion, resulting from labor shortage due to the Coronavirus pandemic. Others hypothesize that a flood of liquidity into the global economy, which stems from quantitative easing dating back to the financial crisis in 2007-2009, is the cause of rising prices. Regardless of the reason, the concern is that gains in wages and market appreciation are muted, or worse, erased, by an escalation in prices for goods and services.


Inflation’s History

It has been three decades since we've seen inflation at current levels and even longer since inflation averaged double digits (several different times in the mid-70s to early 80s)[1]. Clients of our firm who remember the 1970s recall long gas lines, borrowing for a home purchase at 15%, and investing in treasury bonds at over 10%.

Consider this: in October of 1981, the 30-year mortgage rate was 18.45%[2]. As I type, that sort of rate seems almost unthinkable, yet it's true. To illustrate how it would impact the average homeowner or investor today, imagine a $500,000 home purchase with a 20% down payment. An individual would be financing $400,000 and be left with a $6,175 payment!


How Does Inflation Work?

Inflation works in a similar way with food, gas, and other products and services we use regularly. Inflation can be viewed as a tax that leaves consumers with less to spend at the end of each month. With consumers facing higher prices, the dollars they spend must go to the staples such as food, housing, and gas—while potentially having less to spend on discretionary items such as travel and entertainment.

To combat inflation, the Federal Reserve (the Fed) will typically increase short-term borrowing costs on member banks—which in turn, trickles down to the consumer. Managing inflation is a primary objective of the Federal Reserve. The inflation target for the Federal Reserve is 2%. With both headline and core inflation trending well above those targets, aggressive rate increases are warranted. Surely the invasion of the Ukraine by Russia has complicated the Fed’s rate decision. My previous article “War and the Market: What Does History Teach Us?” discusses this topic further. Despite the concern over the war in Ukraine, the question is not if the Fed will raise rates. Instead, it’s a matter of how fast the Fed will hike rates and when they will stop.


Our Recommendations

First, revisit your budget. See where you are seeing the biggest increases as some individuals are impacted far more than others. For example, my brother is a sports fisherman who is impacted much more by the price of fuel than I am with a five-mile commute to work. At the same time, a family of seven will feel food inflation much more than my parents, who have been empty nesters for almost 30 years. Secondly, once you have revised your budget, a conversation with your advisor can be warranted. For some who are living off a fixed income, the process will require pairing back or needing larger distributions from your portfolio. For others, it may prompt a change in your investment mix. While for many clients, the process may entail staying the course.

Investors whose investment horizon is long-term should continue to invest in a diversified, low-cost, equity-leaning portfolio. However, for investors who are either uneasy with market gyrations or have a more condensed investment timeline, multiple levers can be pulled to potentially position the portfolio to hold up well during inflationary times. Many experts agree that treasury bills and private real estate hold up well during inflation. [3],[4] It is also important to note that during inflation cycles, equities do well; however, volatility can increase, making maintaining a portfolio heavy on stocks problematic for investors whose emotions can get the best of them.


Guidance for Those who are Worried

If you are prone to worry about your investments, there are several actions to consider. First, consider looking at your investments less often. This does not mean a “head in the sand” approach. Instead, if you are looking at your portfolio a few times per day, consider a few times per week. Or, if it’s weekly, consider checking in on your accounts monthly. Second, look at history for context surrounding the volatility. What you will find is that the market, on average, experiences a 14% intra-year drops since 1980. This may not provide you all the peace you want , but having perspective on what is normal can be helpful in curbing emotions. To further combat mixing emotions with investments, read “How to Avoid the Investing Cycle of Emotions” by our own Will Kellar, CFP®. Finally, if the volatility is cause for sleepless nights, you may be someone that needs to take less risk, meaning a conversation with your advisor is warranted.

Because the course of this inflationary cycle is unknown, it is essential for all investors to track their spending to determine what impact inflation has had on budgets. For some, there is plenty of discretionary capital to absorb the increase prices; however, for others, it may be necessary to tighten the belt and prioritize essential spending, to minimize the impact of elevated costs.

[1] U.S. Inflation Calculator

[2] History of Mortgage Interest Rates

[3] Fama, E. F., & Schwert, G. W. (1977). Asset returns and inflation. Journal of financial economics, 5(2), 115-146.

[4] Crawford, G., Liew, J. K. S., & Marks, A. (2013). Investing Under Inflation Risk. The Journal of Portfolio Management, 39(3), 123-135.


If you have feedback for us, have questions, or would like to hear more on other topics we’ve not already covered, please email us directly at hi@humaninvesting.com. We cherish the emails and questions and look forward to connecting with you soon.


Related Articles

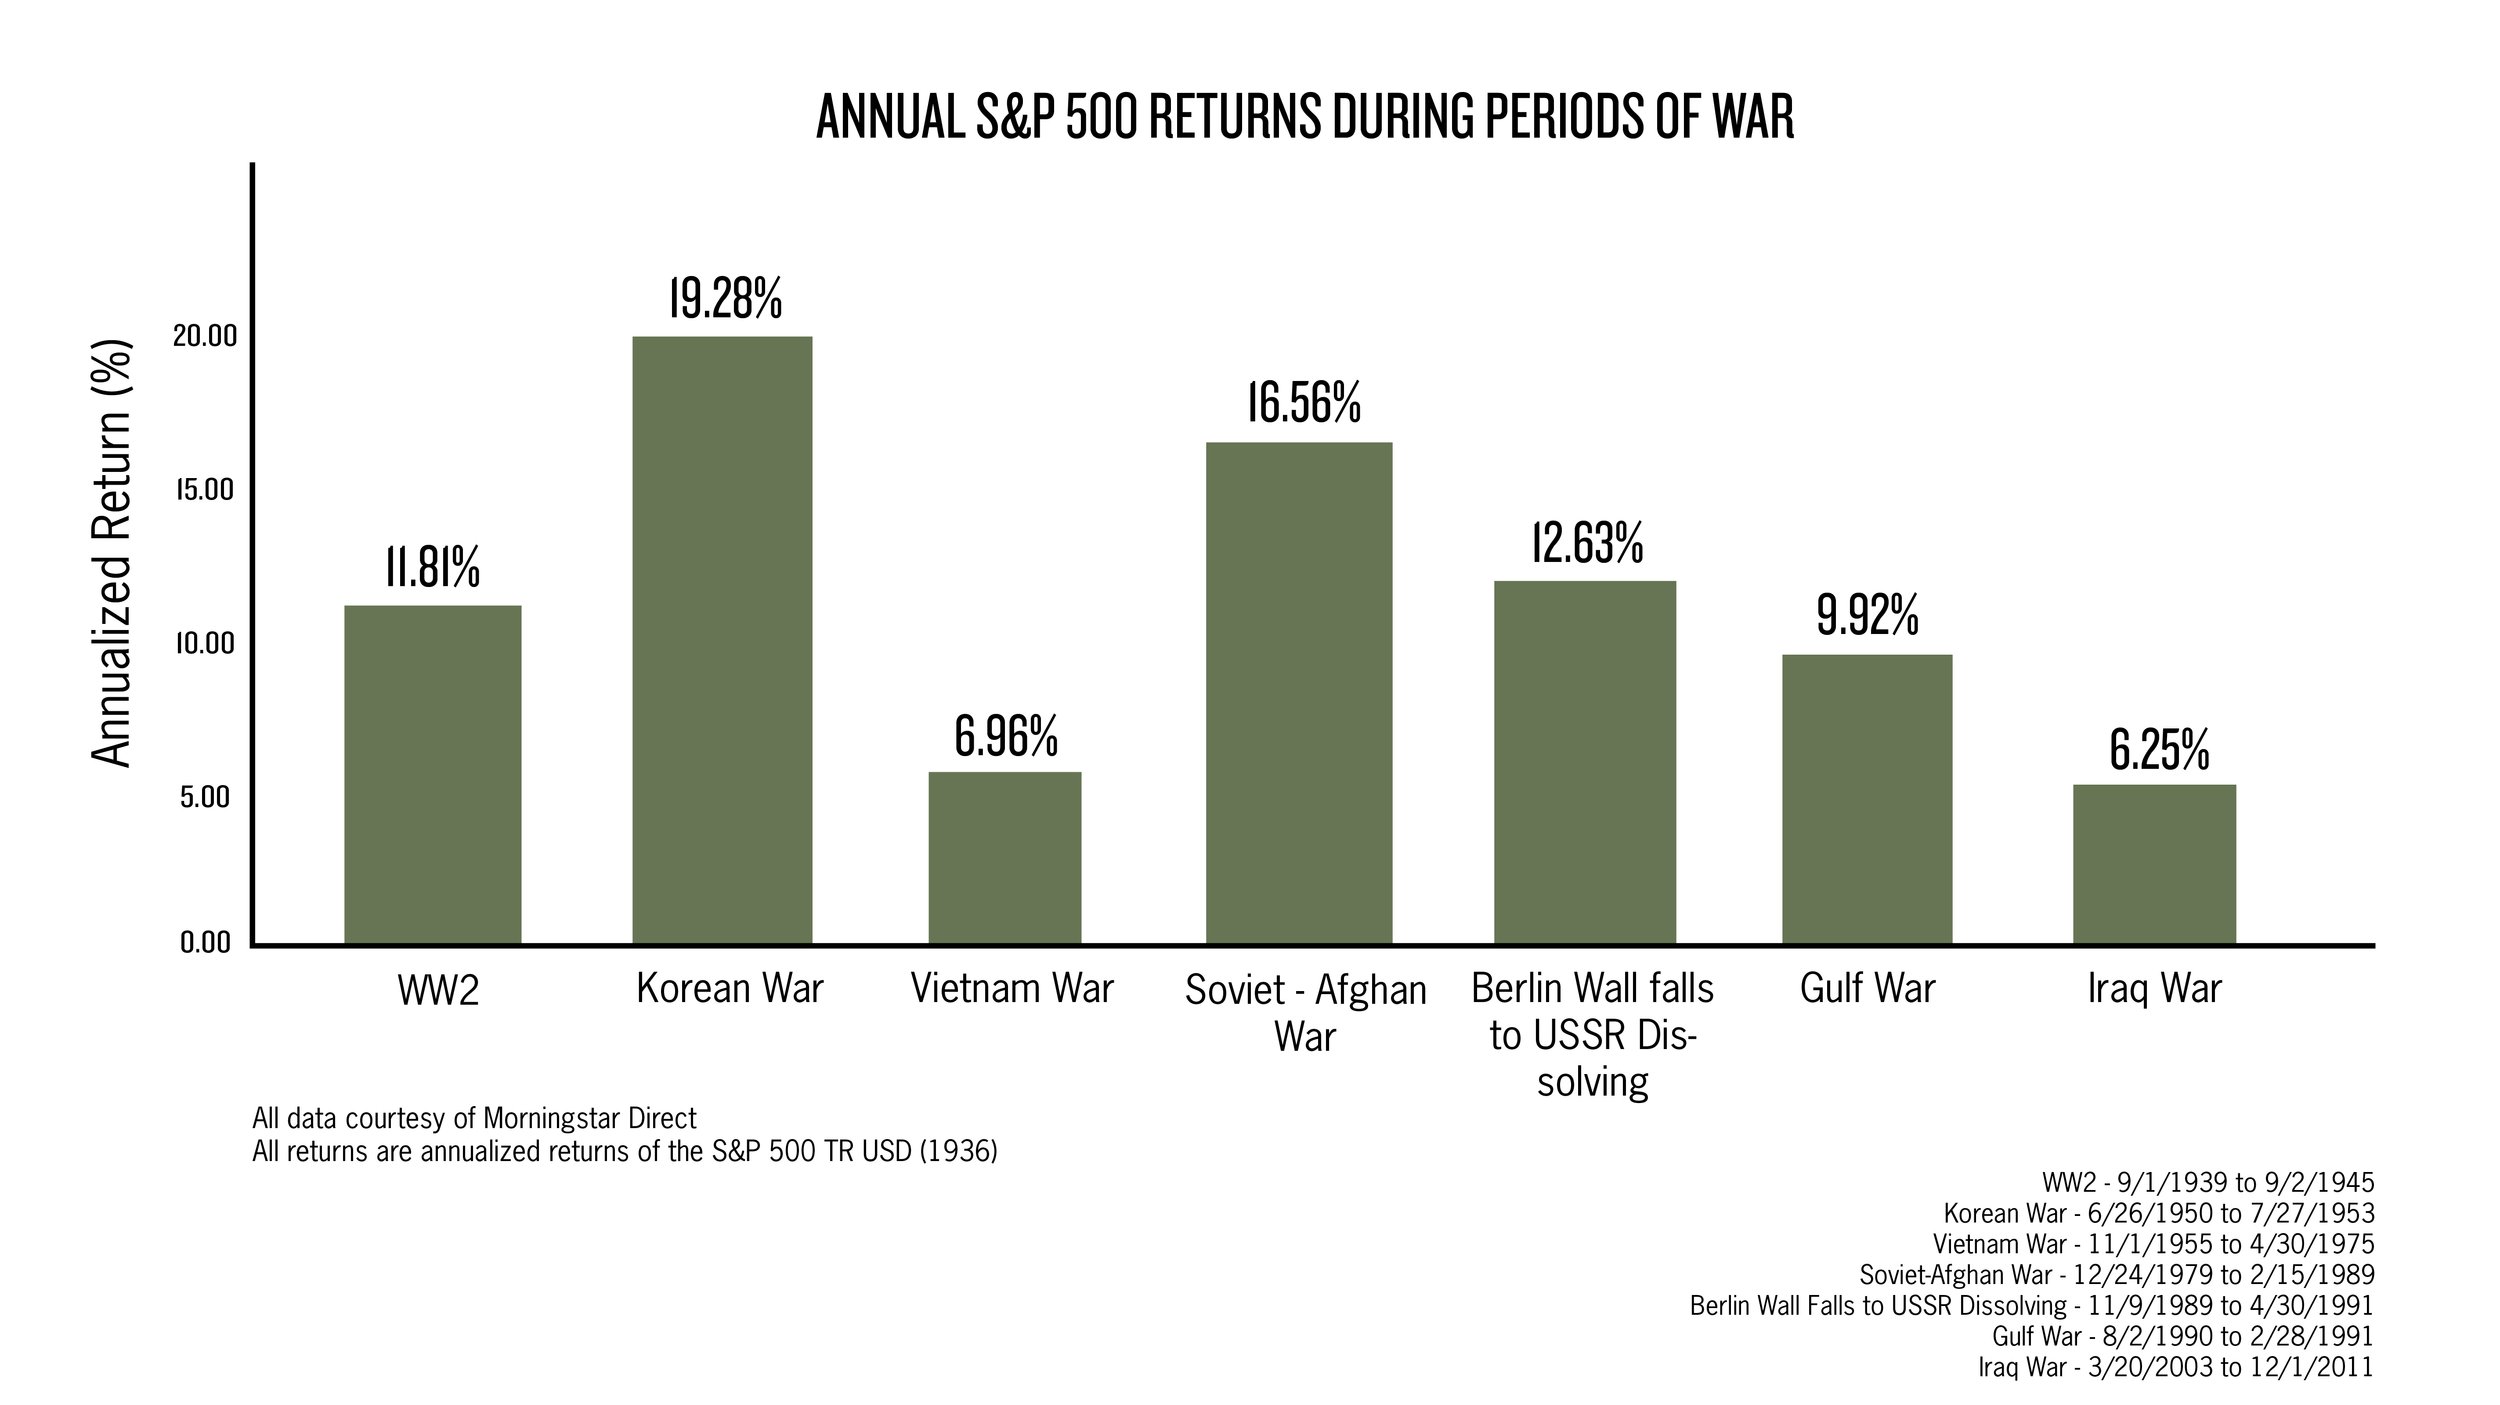
War and the Market: What Does History Teach Us?
 

With Russia’s invasion of Ukraine this week, many are wondering how a conflict in Europe will influence their own finances. In addressing this headline for our firm, please understand that the loss of life and the disruption of peace weighs heavy on me and our team. While considering investor concerns, our goal is to provide a point of view which I feel we are uniquely positioned to share amid war as a financial management firm.

Markets trade on future expectations. For example, if the market expects new jobs or a strong economy, then people and businesses adjust their decisions today, based on what they believe is coming. Remember how the market crashed when COVID-19 first hit the United States, but bounced back a month later? That’s because people were making choices based on expectations, not necessarily reality.[1] Because war follows a circuitous route, forecasts are less clear. Researchers accurately note that “the impact of conflict on human lives, economic development, and the environment is devastating.”[2]

Previous Wars and Invasions Show That Market Reactions can Range Wildly.

For example, in 1990, Iraq invaded Kuwait and immediately the global stock markets declined.[3] In the three days that followed the Iraqi attack on Kuwait, the Dow Jones Index slid over 6%; yet in the first four weeks of Operation Desert Storm, the Dow gained 17%.[4] Additionally, the European Stock market responded positively to the second conflict with Iraq in early 2000. Stock market history has shown divergent reactions to war.


Surely, the economy of Ukraine will be devastated, but no one knows what the financial repercussions from this Eastern Europe conflict are. For example, when the news broke about Russia’s invasion, the European markets went down around 4%, but the US market went up by about 1.5% at the end of the day. We simply can’t predict the future, and the market changes moment-to-moment, day-to-day. The only real certainty is that volatility will resume as individuals and institutions place their bets on future predictions, and because of this, our client financial plans and asset mixes navigate all types of situations.

Finding your Footing in Uncertainty

Market related volatility is an un-welcomed but natural part of the investing journey, so our client portfolios at Human Investing are constructed with a plan and risk tolerance in mind. For example, a client that has cash needs to support their day-to-day expenses (such as a retiree) will often have a portfolio with equities that pay dividends, bonds that pay interest, and ample cash to cover upcoming obligations. On the other hand, investors who rely on equities should understand that stock volatility is the price we pay for the expected premium we receive in the long run over cash and bonds.

Although the headlines of “war” and “invasion” cause anxiety, the questions investors should ask are, “How is my plan working out?” and “Despite the market volatility, am I still on track?” Keep in mind that although the average annualized return of the S&P 500 since 1926 is approximately 10.5%, market swings may increase considerably. [5]  Investors should think about their financial plan, investment goals, timelines, and overall diversification to determine how well they are prepared to manage the ups and downs. Adjustments can always be made to ease the concern in the short term, but for most of our clients, their financial plan and current asset allocation take into account market downturns, caused by a myriad of events, including invasions and war.  Through it all, we at Human Investing are present in all of life’s ups and downs as we faithfully serve the financial pursuits of all people.


[1] Frazier, L. (2021, February 11). The coronavirus crash of 2020, and the investing lesson it taught us, Forbes. The Coronavirus Crash Of 2020, And The Investing Lesson It Taught Us

[2] Cranna, M. (1994). The true cost of conflict. New York: New Press. The true cost of conflict / | Colorado Christian University

[3] Richter, P. (1990, August 3). Markets react to Kuwait crisis: Stocks: Invasion rocks market; dow slides 34.66, Los Angeles Times. MARKETS REACT TO KUWAIT CRISIS : Stocks : Invasion Rocks Market; Dow Slides

[4] Schneider, G., & Troeger, V. E. (2006). War and the world economy: Stock market reactions to international conflicts. Journal of conflict resolution50(5), 623-645. War and the World Economy: Stock Market Reactions to International Conflicts

[5] Maverick, J. B. (2022, January 13). What is the average annual return for the S&P 500? Investopedia. S&P 500 Average Return: Overview, History, and Factors


Related Articles

The Big Short: Volume II Starring $GME
 
image.jpg

Last week GameStop went viral as a topic unlike anything I’d seen in my 10 years at Human Investing. Probably just like you, I googled “Gamma Squeeze”, had someone two degrees of separation from me divulge they had been a part of wallstreetbets, and now have significantly more money, and felt like I was watching a version of March Madness play out real-time in the financial markets.

With the introduction of free trading and the gamification of trading stocks with apps like Robinhood, this past week was the culmination of many factors colliding (more on that later). Different than in The Big Short (2008 Real Estate Crisis) where select hedge funds were taking advantage of large investment banks being overleveraged in the housing market, this time it was retail investors taking advantage of hedge funds overleveraged in GameStop. If Michael Lewis or someone else isn‘t writing this book already I’d be shocked, and I can’t wait for the movie too.

Most of the questions our team has been fielding this week looked like a version of:

  • Why GameStop?

  • Why now?

  • Explain this to me like I’m 5

  • Is this a one-time occurrence or is something like this going to be happening more frequently?

  • And probably most importantly what does this mean for me, my investments, and the markets as a whole?

To help me answer some of these questions I’ve enlisted our head analyst, Andrew Gladhill. In our office known as Glads. For those of you who haven’t spoken with Glads or seen his work, he’s a CFA and anyone who knows him would most likely have him on their Who Wants to be Millionaire “phone a friend” shortlist. Maybe most importantly, one of the ways Glads makes our team better is being able to take complex topics and break them down in very digestible terms. Take it away!

Some key terms you need to know

Shorting

The short answer: Shorting is betting that a price will go down (not up), and you benefit as the price goes down. For example, if you short a stock trading at $20, and it goes down to $15, you have made $5.

The long answer: Shorting works through a few steps:

  • Step 1 – you borrow the stock today from someone who holds the stock (Let’s call them Emily) with a set date you must return the stock back to Emily. Emily lends you the stock because Emily charges you interest.

  • Step 2 – you sell the stock today (say for $20)

  • Step 3 – you must return the stock to Emily, plus interest (say $1) buying it at the current market price to do so (say $15)

  • In this example, you have made $4 (Sold for $20, bought for $15, charged $1 interest)

Why do you short? Because you believe something is overvalued, and you want to profit from when the price goes down.

short-selling copy.jpg

Short Squeeze

The short answer: When a shorted position has the price increase, those who are shorting it (the shorters) are forced to buy the position, driving the price up further.

The long answer: If the price rises on a short position, the shorter starts losing money. They can either hedge their losses by buying the stock before the return date, or wait to buy and hope the price falls. Remember, the shorter must return the stock to the original owner by a set deadline. Because the price of the stock can rise higher and higher, the shorter’s potential loss is limitless.

So a short squeeze is when the price of a company goes up because lots of people are buying a heavily shorted stock, increasing the price. The rise in price causes some shorters to close out their positions, which involves buying the stock. More buying activity causes the price to increase, causing greater losses for the shorters. If the price rises high enough, the losses get large enough that more shorters are forced to close out their short position to avoid having their total portfolio value go negative. This creates a positive feedback cycle of buying activity, pushing the stock price even higher.

cycle.jpg

Why WAS Gamestop ($GME) TARGETED?

The Short answer: GME had an unusually high amount of shares sold short, allowing the short squeeze to be possible. Retail investors gathered online & decided to try to make it happen.

The Long Answer: Short float is the number of shares sold short (borrowed & then sold) that have not yet been repurchased. Gamestop had a short float over 100%, meaning some shares of Gamestop had been lent out more than once. This happened because many believed Gamestop (a retail video game store) was the next Blockbuster and would go out of business. The share price would go to $0 a share, and they would profit from the price dropping. Some retail investors noticed the high short float on GME in an online community known as reddit wallstreetbets (aka WSB, aka retail investors). The retail investors saw an opportunity for a short squeeze due to the large short interest, and GME being a relatively small company.

The retail investors planned to force a short squeeze on GME. The retail investors would buy up as many shares of GME as possible, driving up the price. The retail investors would hold their shares, drying up the supply, pushing the price up even further. All this upward price movement would force a short squeeze, driving the price up even further, and the positive feedback cycle would result in astronomical price increases for GME as the short squeeze hits. Retail investors will be able to sell their shares at high prices to the shorters forced to closing out their position.

Why was trading restricted?

The short answer: Companies that execute trades (brokerages, i.e. Robinhood) must have money to cover trade differences with clearing firms (the back end companies that finalize trades) as collateral. The rapid, unexpected movement in GME brought some brokerages ability to do that into question, and they had to pause the trading until they could secure more funding.

The long answer: When you sell or purchase a stock, that trade isn’t finalized until settlement, which is 2 days later. This time is used to verify the transfer of cash & the security purchased. It’s like when you deposit a check at the bank, the bank makes sure the check clears before you can withdraw cash. Clearing firms finalize stock transactions. The brokerages (i.e. Robinhood, Fidelity, Schwab, e-Trade) are required by law to maintain cash deposits as collateral with clearing firms to cover any losses. The required deposits by the clearing firms for the brokerages went up because GME was having higher price volatility. Some brokerages had to pause trading in GME while they secured enough funding to make the deposits required by the clearing firms. The financial system rarely handles meteoric rises in stock prices in such a short amount of time, and certain parts of the system that normally work so smoothly we never think about them suddenly brought trading to a screeching halt.

what does this mean for me and my portfolio?

Thank you, Glads. This story and its ramifications are certainly not finished. As more details come out it will continue to paint a clearer picture of what it means for investors over the past week and looking forward as well. To bring this all home and answer the question, “what does this mean for me and my portfolio” a few thoughts:

While Gamestop took up all the headlines this past week, for most investors it had little to no impact on their portfolio. For example, the Vanguard Total Stock Market Fund (VTI), is a staple in many retirement accounts across the country, the fund was down 3.59% last week (in line with the market). GameStop contributed a positive 0.04% return to the fund (basically nothing!) despite being up nearly 655% on the week, a bi-product of how small of a company GameStop is relative to other companies in the fund that truly move the needle.

vanguard.jpg

So should I get in?

Should you open up a trading account in preparation of the next public short-squeeze? The boring/correct answer is this is not the forum to be giving specific financial advice for your specific situation. If you’re truly speculating about that and want to talk to it through, PLEASE sign up for a Calendly link with one of our advisors and they are happy to talk with you about it.

My favorite book I’ve read in the past few months is The Psychology of Money by Morgan Housel. It’s one of the best (in my opinion) personal finance books because it focuses on behavior (potential controllable actions) rather than guessing what’s the next best stock is. He has an entire chapter devoted to the topic of, “People have a tendency to be influenced by the actions of other people who are playing a different financial game than they are.” This is the case for most people saving for retirement when thinking about GameStop, shorting, and what we’ve seen in the news. It’s Human to feel like you missed on an opportunity with GameStop and to want to hit it big on the next trade. But most likely that’s not your game.  Most likely your game (and mine too) involves saving and investing for a long time, letting compounding interest take care of the rest, and maybe most importantly staying out of your own way. And while that game doesn’t create the same headlines, as Housel writes in a different chapter it can create a different type of headline to aspire to.


Related Articles

How Some Millennials are More Resilient during Financial Shocks
 

According to most research, although millennials are considered the most highly educated generation, we are the least informed when it comes to our financial decisions. Not only do we lack financial literacy, but pre COVID-19, 63% of millennials felt anxious when thinking about their financial situation, and 55% felt stressed when discussing their financial situation. I imagine COVID-19 has negatively impacted those figures even further.

There are many factors that affect our personal financial stress levels, but historically, the financial industry has felt inaccessible to those who lack financial literacy and/or feel insecure about their financial situation. How are we supposed to learn if we lack access to knowledge?

SAVINGS APPS TO SAVE THE DAY

I love the concept of savings apps, because it improves accessibility of investing and saving for a large population. Basically, if you have a smart phone and a few extra dollars, you can be a saver. A study conducted in 2019 found that individuals who used savings apps kept better track of their finances and were more resilient when faced with a financial shock. However, accessibility without education can be hazardous. So, here are two recommended savings apps that provide learning and saving opportunities.

  • Mint is a free app powered by INTUIT (think Turbo Tax) that houses all of your financial information in one place. Mint uses a holistic view and budgeting tools to find extra savings for you. Not only do they provide you with custom savings tips, but they also have a hub of resources, ranging from building a grocery budget to investing advice, so you can learn along the way!

  • Digit has the same philosophy as Mint: find savings within your current financial situation. With this philosophy, Digit analyzes your current income and expenses and then lets you know what you can afford to save. They invest your dollars in FDIC insured account using a portfolio based on your risk level and comfortability. You are also able to attach these savings to a specific goal – emergency savings, honeymoon, a doggo—you name it. There is a monthly cost of $5, but you do receive 1% annual bonus savings every three months.

NOT FEELING IT? FOLLOW THEIR SAVING PHILOSOPHIES

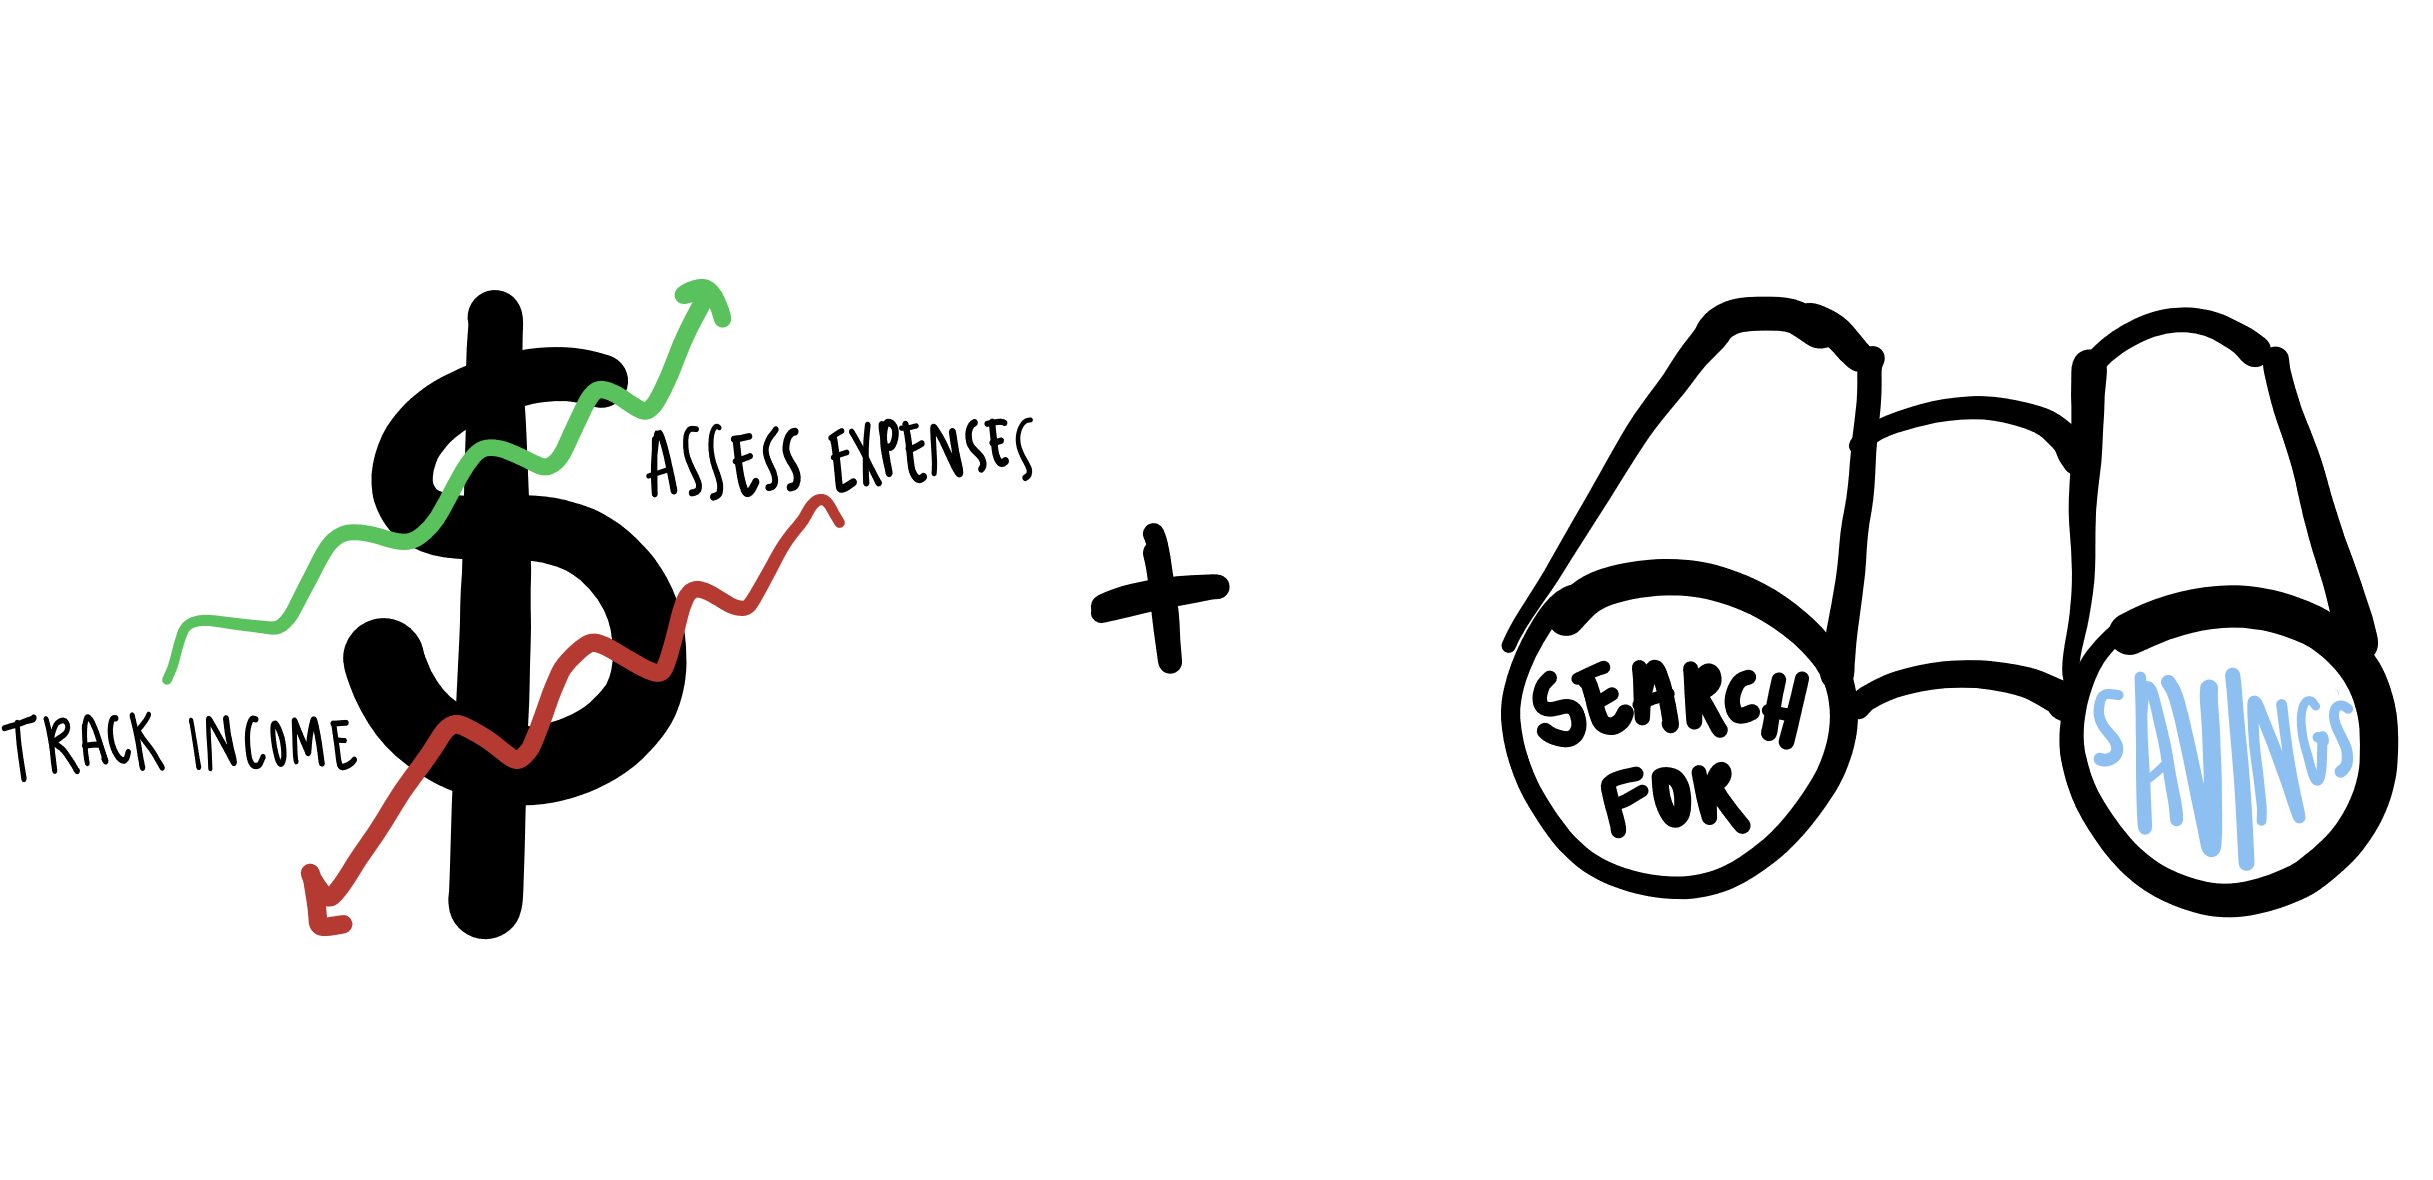
It’s okay if you don’t vibe with the savings app world. But if you do want a better grip on your finances, follow the philosophy behind the savings apps:

  1. Keep track of your income.

  2. Assess your spending habits.

  3. See where you can save.

savings blog doodle23.png

For me, that looks like walking past the gluten-free bakery every so often instead of into it (which is usually the case) and saving the extra $5. At the end of the month it can make a difference (Don’t believe me? See how much you can save by ditching your morning coffee here).

Finally, allow yourself to interact with financial resources without being too hard on yourself. The purpose of these apps is not to be a report card. The purpose is to empower you to make thoughtful decisions that will improve your financial health. If you have questions, check out our Financial Wellness Center or reach out! We are here for you.


Related Articles

When Market Crashes are Like Rock Climbing Falls
 
brook-anderson-gTQbZXL417Q-unsplash.jpg

“Am I okay?” Fear ripe in my voice. 

We just heard what no climber ever wants to hear: one loud scream, three thuds, then nothing.

At that moment, I was sixty feet in the air doing the routine work of cleaning the anchor, removing all the gear that protected us as we climbed up the route and re-setting the rope to be lowered and move on to the next climb when we heard it.

That sound? It was someone falling. Hard. We didn’t know how far or how badly, but we knew that climb was higher than mine: about eighty feet top to earth.

“I got you!” He called back. “Take a deep breath. Tell me what you’re doing.”

I did. I called out every single step I was taking to clean the anchor and secure the rope back to my harness –triple checked for safety – and he held the rope. Eventually, my feet and wobbling legs arrived safely back on earth.

When you rock climb, there is obvious risk involved. Risk that you accept as the price of admission for moving higher than twenty feet – the height where, if you fall, you most likely will not be fatally injured. 

Confidence matters. Confidence in your gear, skill, weather, and your risk tolerance. Yet there is a confidence that is as important – if not more important – than all the confidence inside you: that is confidence in your belay partner.

Your partner is the one on the other end of the rope, your safety line, whose responsibility it is to pay attention, catch you when you fall, and lower you safely from sky to earth. A good belay partner must not only know the mechanics of climbing and safety but must also know you. They communicate clearly and are always paying attention – often mitigating the risks that are out of your control when you chose to leave the earth and head toward the open blue.

At no point after hearing those falling sounds did anything feel ok. My imagination was a wild hostage situation, forcing in front of my focus nightmares of gear failing and my body hurling through space.

But in reality, I was okay. I was safely anchored.  We had a plan and practice in place for climbing safely. My belay partner was paying attention, “I got you”. He heard the sounds too, but he did not take his focus off the rope and my safety.

Investing in the stock market can be a lot like rock climbing

There is risk involved in climbing your portfolio value higher than a modest, though acceptable, goal of beating inflation.

When the market takes a dive and the media heads are talking about total economic fall-out, it sure doesn’t feel okay. Do you have a good partner? A good advisor is a good partner. 

Are they paying attention? When you hear the rumble and scary sounds of the market moving and you call out, “Am I okay?”, how does your advisor respond?

At Human Investing, we are your partner on the other end of the rope

  • Our climbing anchor is the fiduciary standard. Every trade, conversation, and piece of back-office work is done to mitigate unnecessary risk as your portfolio climbs, and it is all done with YOUR best interest in mind.

  • Our figure-eight is clean and tight.  Your financial plan is like tying the climbing rope in to your harness – it is your safety line that serves to mitigate risk by informing how your dollars are invested to avoid and securely catch any falls. When the market crashes, we are on the other end of the line. 

  • Our GriGri is loaded and locked.  We have the highest standard in investment tools.  We know our tools and we use them well, monitoring the “weather patterns” of the market, watching your portfolio as it climbs and responding as appropriate.

  • “On Belay? Belay on! Climbing? Climb on!”  Before you climb you say to your partner:  Are you ready and paying attention?  We are paying attention and ready to serve you. There is more than one set of eyes on your accounts – you are more than dollars and stock holdings to us.  We will not be distracted by the noise around us.

  • “I got you!”  As with any good partner: We know you.  We will respond to fear or a fall.  Your time with us is invested in discussing your goals, your values, and your reactions when your portfolio climbs or lurches.  We answer when you call, and sometimes we call you first because we also hear the sounds of the news and peers, and it may be scary. But in the end, we “got you.” We will not allow a fall-fear to inflict avoidable loss.

If you would like to talk to an advisor about how to climb your portfolio the Human Investing way, give us a call or send us an email.  It would be our pleasure to partner with you.


Related Articles

$5 Today is Worth More than $5 Tomorrow
 

Saving your hard-earned dollars is a better game plan than frivolously spending money. However, keeping your savings in cash (not investing the dollars) is also risky. This risk is called inflation. To substantiate inflation, we found the increase in price of Stumptown Coffee Roasters lattes since 2014.  

**This article is not about Stumptown increasing the costs of their lattes. Suppliers, just like buyers, pay more for the goods they buy when inflation is rising. Stumptown consistently ranks among the best coffee shops in Portland!**

Flashback! It’s 2014…

You have $5.00 to go spend at Stumptown Roasters. That will buy you a delicious medium latte for $3.75 and a shortbread cookie for $1.25. Treat yourself!

2014.jpg

Let’s say, instead of spending that $5.00 in 2014, you put it under your mattress for safe keeping. You find the $5.00 a few years later and still frequent Stumptown. We are going to run through a few scenarios of the purchasing power of that same $5.00 bill.

Two years have passed, and it is now 2016.

Your beloved medium latte now costs $4.00, and the shortbread cookie costs $1.35. You find $.35 in your pocket (does finding coins ever happen anymore?!), so you make the purchase possible.

2016.jpg

Four years have passed, and it is now 2018.

That same tasty medium latte now costs $4.50, and the shortbread cookie costs $1.50. You might be going home hungry.

2018.jpg

Fast forward six years to 2020…

Your medium latte now costs $4.75, and the shortbread cookie costs $1.60. Assuming you would leave the barista a tip, your $5.00 bill cannot even buy you a coffee. You might be going home thirsty and hungry.

2020.jpg

Magnifying inflation’s effects on bigger life decisions

In this example, the cost of a coffee and a cookie only changed by $1.33 over six years. While that may not seem significant (the increase is less than $2!), the cost of goods did increase by 26%. If you apply that percent increase to a larger purchase like a home, a car, or education savings, you may not be able to afford what you intended.

One way to maintain purchasing power is to invest the $5.00 into the stock market. If you bought the S&P 500 in 2014, then that same $5.00 would be worth around $9.40 today in 2020, which is enough to pay for a coffee and cookie from Stumptown. For simplicity purposes, we only looked at the rising cost of coffee and S&P 500 return since 2014. To further substantiate the decrease of purchasing power over time, we included a chart that compares the S&P 500 total return to the purchasing power of a dollar since 1990. 

Coffee Chart.png

If you have questions or need help preparing an investment strategy for your savings, please contact our team at Human Investing. We drink good coffee.  


Related Articles