Posts in Managing your Portfolio
Why Dollar-Cost Averaging is a Great Investment Strategy
 

A recent theme in our client conversations has been around the timing of investing. On a regular basis we hear the question, “when is the right time to invest?” especially when times are uncertain. It’s a great question, one that is worth considering, but before answering this question let me state: We at Human Investing are long-term investors. Don’t mistake that for “buy and hold,” but rather “buy and assess.” Additionally, we believe financial planning is the key to investment success. While planning does not guarantee success, it does improve the odds of a successful outcome. In our advisory practice, the financial plan informs the investment decision.

Once the plan is in place and we’ve made the decision to invest, the timing of investing may not always mean we push a button to invest one hundred percent of someone’s capital in that moment. What it does mean is that we have a thoughtful discussion on the different strategies we might utilize to put the money to work, choosing the right option based on the client’s plan and their input.

Let’s walk through an example. The chart below is a hypothetical client who invests $500 per month ($6k/year) over an eleven year period starting January 2007 and ending December 2017. For this exercise we simulated investing the $500/month into a simple total stock market index exchange-traded fund with the symbol ITOT. The total invested capital in 2007 was $66,000 with net proceeds of $136,809 on the last day of 2017. Pretty incredible results considering the eleven year time frame included small gain and loss years of 2007, 2011, and 2015 and a large loss of 39.42% in 2008.

Picture1.png

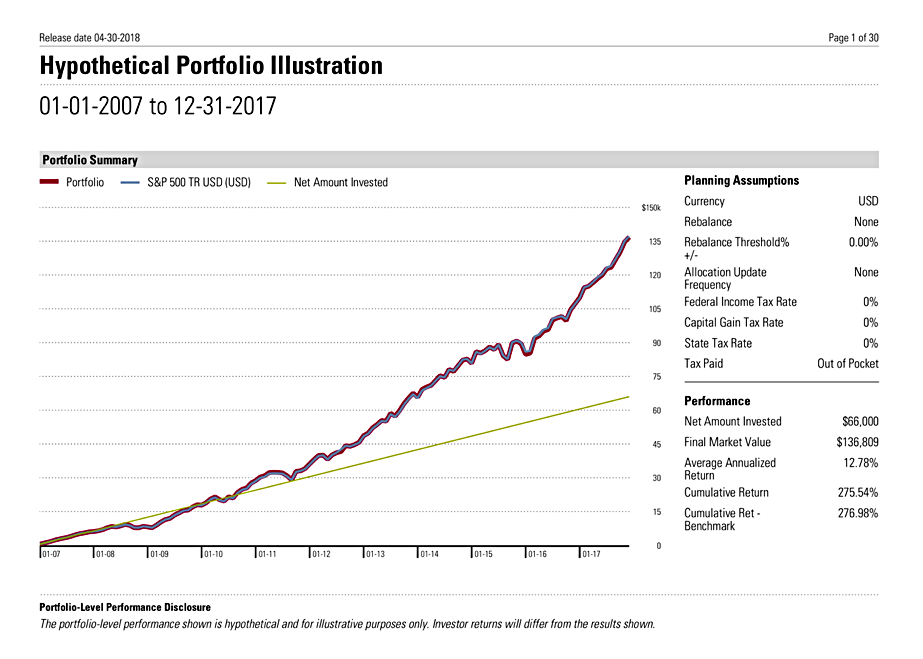
This is a great example of a strategy called dollar-cost averaging. Dollar-cost averaging is an investment strategy with the goal of reducing the impact of volatility on large purchases by adding small amounts of the intended purchase into the market over a specified period of time. Technically speaking, taking a lump sum and immediately investing the funds for an extended period of time is the best option. The challenge with the lump sum method is that many investors struggle to invest 100% of their money right away due to factors like willpower and emotion. With the dollar-cost averaging approach the investor puts his money to work bit-by-bit, which for many, feels good emotionally and prevents money ear-marked for investing from staying in cash too long. For these reasons and others, the methodical dollar-cost averaging approach has become the most successful way to invest capital for the long-run.

My intent is not to vilify a cash investment as bad. For many investors cash has a place and a purpose within their overall portfolio. I’m looking to highlight an effective approach/strategy for when a client’s financial plan requires a greater return than 1%.  

If you’ve asked the question, “What is this money for?” and the timeline is long-term, consider the total sum you are looking to invest, divide that sum into a reasonable time period and make a commitment to dollar-cost average those funds into the market. In doing so you won’t find that you’ve kept the funds in cash for any longer than is necessary, and you will be well on your way to your stated long-term savings and investment goal.


Related Articles

Question. Discipline. Patience.
 

Investor Principles for Success

Investors big and small, sophisticated and simple, struggle to get the investment returns they desire. DALBAR and Associates and others have documented the performance shortfall for years, but few tangible solutions exist to close the gap between actual returns and expected returns. From what I’ve observed, I believe the core of investors and their advisor’s failure is in not asking the question, “What is the investment for? What is the savings goal?” prior to making investment decisions.

* DALBAR; Blackrock

* DALBAR; Blackrock

By consequence investors have failed to keep up with the performance of even the most passive investment. As mentioned, the success or failure of the individual investor is well documented by DALBAR and Associates. In the ten years leading up to 2016, investor returns (for asset allocation funds) were 1.89% per year. This return is far less than what a bond index (e.g. Barclays Agg.) would have yielded at 4.51%. The moral of the story? Individual investor behavior is a major contributing factor to under-performance. 

ASK THE QUESTION

Both advisors and individual investors must ask the question, “What is this investment for?” In other words, what are you trying to accomplish by foregoing spending right now and instead saving those dollars? Answering this question will create a goal/objective for the savings and will lead to investments that optimally align with the stated goal.

Consider for example Jane, a 25 year old investor with two different saving goals: 1) save for a house; and 2) save for retirement. It is fine if Jane thinks, “I’d like to be aggressive because I’m an aggressive person,” but that posture aligns much better with the retirement account that has 35-45 years before it is needed than it does for the house savings account with a 3-5 year saving and investing timeline. Because aligning investments with both the goal and the timeline is crucial when investing, ask the question, “Why am I saving. What is this for?”

BE DISCIPLINED

After you’ve answered the question for yourself and made the corresponding investments to align with your stated goal and timeline, it’s all about discipline. If like Jane you have a three to five year savings goal, then the objective would be a stable portfolio. But what if, during that time, Jane thought to herself, “The stock market is doing so well and my friend has made so much money investing in XYZ stock, maybe I’ll try and make a little more too.” While that is a fine thought, in the context of the goal and timeline, to act on it would be undisciplined. If the goal is to buy a house and it’s a short-term goal, the action for Jane is to maintain a stable job, budget her income, and stay disciplined to her investment plan since these will be key drivers in her ability to save for and purchase a house...not the stock her friend bought.

A lack of investment discipline may also impact the long-term investor. What if Jane made some aggressive choices for her VERY long-term retirement account? One day, the same friend who bought XYZ stock tells Jane, “I sold my stock. It was getting crushed. The market is crashing.” Jane may very easily feel that she made the wrong decision by investing “aggressively” in her retirement account and in reaction, sell. Being disciplined is about sticking to a prudent investment strategy based on your needs and timeline. For Jane, discipline may look like HOLDING these more volatile higher-earning investments not based on the short-term return but rather her long-term goals.

If the stated saving goals were aligned with the right investments, then there would be minimal volatility in the short-term house savings account. Similarly, with a longer-term goal (retirement) in place, Jane would expect to see more volatility with higher long-term returns than with the more stable investments she made for the house.

BE PATIENT

Whether you are an advisor or an individual investor, if you’ve asked the right questions and you have an investment plan to accomplish your goals, then be patient and wait for that plan to play itself out. If you’ve done the work upfront, then your probability for success will be much higher than if you failed to ask the question and go through the process.

Looking at the poor performance of the individual investor leads me to conclude two things: 1) too many investors have not asked the right question upfront to make an investment plan to meet their specific goals; and 2) those who may have started out by asking the right question have failed to stay disciplined to their objectives.


In summary,

1.       Ask the questions: “What is the purpose of these funds? What is the point of saving instead of spending?”

2.       Be disciplined

3.       Be patient


Sources: *BlackRock; Bloomberg; Informa Investment Solutions; Dalbar. Past performance is no guarantee of future results. It is not possible to directly invest in an index. Oil is represented by the change in price of the NYMEX Light Sweet Crude Future contract. Contract size is 1,000 barrels with a contract price quoted in U.S. Dollars and Cents per barrel. Delivery dates take place every month of the year. Gold is represented by the change in the spot price of gold in USD per ounce. Homes are represented by the National Association of Realtors’ (NAR) Existing One Family Home Sales Median Price Index. Stocks are represented by the S&P 500 Index, an unmanaged index that consists of the common stocks of 500 large- capitalization companies, within various industrial sectors, most of which are listed on the New York Stock Exchange. Bonds are represented by the BBG Barclay U.S. Aggregate Bond Index, an unmanaged market-weighted index that consists of investment-grade corporate bonds (rated BBB or better), mortgages and U.S. Treasury and government agency issues with at least 1 year to maturity. International Stocks are represented by the MSCI EAFE Index, a broad-based measure of international stock performance. Inflation is represented by the Consumer Price Index. Average Investor is represented by Dalbar’s average asset allocation investor return, which utilizes the net of aggregate mutual fund sales, redemptions and exchanges each month as a measure of investor behavior. Returns are annualized (and total return where applicable) and represent the 20-year period ending 12/31/16 to match Dalbar’s most recent analysis.


Related Articles

Strategies for Employer Plan Participants that hold Employer Stock
 

Do you participate in an employer’s retirement plan in which you own your employer’s stock? Before selling shares or rolling your account over to an IRA, you should consider a special election that could save you significant tax dollars. For taxpayers with employer stock held inside a qualified employer plan, the IRS allows a special election to distribute those shares at their cost basis and recognize the appreciated gain at preferential capital gain tax rates (avoiding “ordinary” income tax rates). This strategy is known as “Net Unrealized Appreciation” and is outlined in IRS code section 402(e)(4). The net unrealized appreciation is referring to the excess fair market value (FMV) of your employer shares over their cost basis. The election creates an immediate income tax liability on the cost basis of the distributed shares, but allows for continued deferral and favorable tax rates on the embedded and future gain.

There are three requirements to qualifying for and executing an “NUA” election strategy. First, the stock must be distributed out of your employer plan “in kind.” Transferring stock “in kind” means you take distribution of the stock itself, not its liquidated cash value. Second, the NUA election must be made as part of a lump sum distribution in a single tax year. You can make the NUA election on all or a portion of your employer stock and make a tax-free rollover with the rest of your account. The rules only stipulate that the entire account must be distributed/rolled over in a single tax year. Lastly, the lump sum distribution must transpire from one of four situations: death, attaining age 59 ½, leaving the company, or disability.

Below is a chart that outlines the tax treatment of employer stock distributed in an NUA election (www.kitces.com)

Graph-1-for-Todd-Strategies-for-retirement-plans.png

For example, let’s say you were a Nike employee and inside your 401(k) you hold 150k of Nike stock. Those shares have been purchased inside your 401(k) over a 20-year career and have an average cost basis of 50k. You retired last month and are looking to roll over your 401(k) assets into an Individual Retirement Account (IRA). Before making the rollover, you decide to make the NUA election on all your Nike stock. The distribution of those shares at their cost basis is immediately taxable at your ordinary income tax rates (i.e. 33% * 50k = $16,500). Those assets are now outside a qualified plan and all embedded and future appreciation can be realized at capital gain rates. Let’s say you then held those Nike shares until they were worth 200k. That 150k gain (200k FMV – 50k basis) would be taxable at 15%, or $22,500. So, in total with an NUA election, you paid $39,000 in Federal income tax. In contrast, by not making the NUA election, and rolling the entire 401(k) into your IRA there is no immediate income tax bill on the rollover, but all embedded and future gains are taxed at ordinary income tax rates. So, using the $200,000 fair market value assumption, and a lower 25% Fed tax rate, your tax bill would be $50,000 when drawn out of the rollover IRA account. The NUA election would have saved $11,000 in Federal income taxes.

Because there is a tradeoff between recognizing income immediately on an “in kind” stock distribution (NUA election) and a full retirement plan rollover, the cost basis in those employer shares is a significant consideration. The lower the cost basis in the shares, the better. Studies have shown unless your cost basis is 50% or less of the stock’s FMV at the date of distribution it is hard to make a case for the NUA election, and a full rollover to an IRA likely makes the most sense (www. kitces.com).

That said, everyone’s situation is different and there are varying factors that may lead to one recommendation over another. Even your desire for charitable giving may weigh in on the decision. For example, let’s say you were to make the NUA election and receive 100 shares with a cost basis of $40 and a FMV of $100; this would create 40k of gross income in the year of distribution. But, if you were to donate 40 of those 100 shares to a charitable organization or donor advised fund, you could create an offsetting 40k charitable contribution deduction. This offsetting deduction could mute the immediate income tax impact and leave you with 60 shares (60k value) that can appreciate at preferential tax rates outside of a retirement account.

There are a multitude of taxpayer specific situations and profiles that may or may not support making the NUA election. So, if you hold employer stock in a qualifying retirement plan and are getting close to retirement, looking to rebalance the account, or sell out of any of those employer shares, please reach out to us and see if an NUA election strategy makes sense for you.

If you would like to talk with one of our advisors please call Jill Novak at 503-905-3100.


Related Articles

Investment Strategies At Different Points In Your Life
 

A blog that our advisors frequent is https://www.kitces.com. On the surface, the structure of the site may look a little unconventional, but after spending some time at the site you will realize that this guy really knows his stuff. One of his recent articles struck a chord with me. Kitces speaks to all the phases of investing and how each “moves the needle” when it comes to saving for retirement and creating an income to supplement a desired retirement. The article breaks down your working years into 4 distinct phases: Earn, Save, Grow, and Preserve. Before I get into the phases let’s have the chart below (showing someone saving $300/month at 8% earnings spanning from age 25 to age 65) guide us through the phases.

Graph-for-Andrews-blog-Aug-1-2017.png

Something that stood out to me in the article was how powerful savings is at the beginning of retirement and how impactful an appropriate allocation is towards the end of your working years.

Consider these two scenarios:

Regardless of whether you are 25, 35, or 45 if you are just starting to save what matters even more than the allocation is how much you are contributing. Imagine if you have an account balance of $1,000 and contribute another $1,000 over the course of the year. With a $1,000 contribution you’ve doubled your money (or grown your balance by 100%). In contrast, if you were to have an above average year of performance, say 10% rate of return, but did not contribute to your account balance you would have grown your account $100. While $100 is nothing to dismiss, we can hopefully agree that it's not going to impact your retirement in a drastic way. Later on in life as your balance grows that 10% return will have a much greater dollar impact, but during the early phases of saving your contributions do most of the heavy lifting when building your account.

As you continue to work and save the pendulum will slowly swing from contributions having the most impact on your account to account growth (or capital appreciation) impacting your account. The below chart (again from Kitces) gives a representation of the importance your allocation has as you progress in your career.

Graph-2-for-Andrews-blog-Aug-1-2017.png

As you can see there is truly a shift in what influences your account most over time. Let’s look at that same $1,000 contribution later in life. Assume you’ve been saving for 20 years and your retirement account has grown to $250,000. The same $1,000 contribution now has less than a 1% impact on your account with the 10% rate of return on your account doing the heavy work to increase your account value by $25,000 (keep in mind a negative 10% return has the same impact on the opposite end of the spectrum).

So where do you go from here? Your savings rate and your allocation are going to impact your account value throughout the course of your working years with each providing great impact at different times during the course of your savings life. In fact, on average after saving in an account for 20 years, market growth accounts for 75% of increases in your account! A great rule of thumb is if you can pinch pennies in your 20s and 30s to build a great base in your account while keeping a growth allocation throughout your working years, you’re on your way to a successful retirement plan.

Call 5039053100

Email 401k@humaninvesting.com Sources

https://www.kitces.com


Related Articles

Identifying your investment risk
 

Our solution to identifying your investment risk… and why it matters

This past weekend my wife and I went and visited two of our best friends in the hospital who just had a baby girl. When we got the text that the baby had arrived, we were in line at the Nike employee store. As we got up the counter, my wife became teary eyed with thoughts of happiness for our friends, as you can imagine the check in person didn’t quite know what to do! The cool thing about being at Nike at that time, was that we were able to pick up this little number as a gift for the newborn, which I would highly recommend simply because it's awesome.

Later that night we went to visit them, and I had not been to a doctor’s office/hospital in a while, and while I was there noticed the “pain tolerance scale” up on the wall in our friend’s room.

This scale has always made me laugh as often times it is usually relative and doesn’t define what the parameters are. What signifies a 10 on the pain scale? A broken leg? Something more painful? I know for me it was crashing my bike and meeting the gravel face first.

This got me thinking about a financial scale that many of us have seen before called the “risk scale”. Most people who have invested before have probably been asked the question, “Are you more of a conservative, moderate, or aggressive investor?” And most people say some form of, “Moderate, I think? I obviously want to make money but don’t want to lose it all”. Similar to the pain tolerance scale, the question needs to be asked; what does conservative, moderate, or aggressive mean? This is a reasonable question many people have a hard time answering. Human Investing has recently partnered with Riskalyze, a company that looks to provide tangible risk information that investors can act on.

risk 2

risk 2

Here is how it works: After completing a simple risk questionnaire you are given a risk score from 1 to 100. This score acts as a benchmark (investor lingo for pain scale) and explains what to expect during different market conditions. For example, if you are invested in the S&P 500 your risk score is a 78 according to the assessment. It also shows you that generally in a given 6 month period of time you can expect a best case return of 28% and a worst case return of -18% with a historical average rate or return of around 9%. As the investor, YOU get to decide if you’re comfortable with that and can look at different investment options or portfolios that fit your goals and timeline best.

So why does this matter? Because over time investors typically under-perform the market due to things like lack of discipline, changing strategies, and trying to time the markets. We believe that a more informed investor who understands their risk and the upside and downside of their allocation can fair better. When I show this tool to 401k participants I often use the following sound bite to explain that most investors are emotional and have a short-term view; In 2014 the 20 year backward looking S&P 500 annualized return was 9.85% while the average US equity mutual fund investor annualized return was only 5.19%! Yes you read that right. Over a 4% difference per year the average investor missed out on.

Our hope is by equipping investors with information like this people can have a better understanding of which investment mix is best for them and how to stick to it over time. Thus, creating higher returns by increasing discipline.

If you are looking for an explanation about the pain scale, I am just as confused as you and probably can’t help. But, if you would like to have a conversation about your risk score and how to implement it, don’t hesitate to email someone from our team or give us a call!


Related Articles

Market Perspective
 

When, for a variety of reasons, the stock market experiences downside pressure, I often spend a lot less time on the headlines and more time on the history. Because every market presents itself differently with no up or down move in the market looking exactly like another, I am compelled to look at what the market has shown us through data that goes back to 1825. After tearing up several drafts over the past few days, I pray I’ve struck the right tone in what you are now reading.  There are several key points I’d like to share after a long weekend of research.

Market Fluctuations Stock market fluctuations are an inevitable part of investing.  Declines in the market never feel good but are quite normal to experience.  History has shown us that declines have varied widely in intensity, length and frequency.

A History of Declines from (1900-December 2014) Dow Jones Industrial Average

Type of Decline        Ave. Frequency                          Ave. Length                 

-5% or more 3 times per year 46 days -10% or more 1 time per year 115 days -15% or more 1 time every two years 216 days -20% or more Approx. once every 3 1/2 yrs. 338 days


As a different point of reference, when observing the market between the years 1825-2013, I see the following:

  • The market had 134 positive years and 55 negative years (the market was positive 71% of the time)

  • 44% of the time, the market finished the year between 0% and +20%

  • 60% of the time the market finished the year between -10% and +20%

  • Only 14% of the time did the market finish worse than -10%

  • Less than 5% of the time did the market finish worse than -20%

  • The market was 5 times more likely to be up 20% or more in a year (50 out of 189) than down 20% or more (just 9 out of 189)!

Lessons learned from past markets:

  1. No one can consistently predict when market declines will happen.

  2. No one can predict how long a decline will last.

  3. No one can consistently predict the right time to get in or out of the market.

  4. The historical odds of making a gain in the market is good.

  5. The historical probability of losing money in the market on any given calendar year is low.

Investing and Emotions In economics and decision theory, loss aversion refers to people's tendency to strongly prefer avoiding losses to acquiring gains. Most studies suggest that losses are psychologically twice as powerful as gains.  I’ve studied loss aversion in the classroom, taught on loss aversion in an academic setting and lived through how this plays out for investors during market declines.  In short, emotions have the potential to destroy an investor’s ability to achieve their financial goals.

In an annual Dalbar study, the research firm stacks up investor returns vs. those of stocks and bonds.  The study, published in early 2015, looked at returns from 1995-2014 which showed the stock market averaging 10% per year for the previous 20 years where the average investor returned around 2.5% - just a hair over inflation.  Much of this underperformance can be attributed to overly confident investors purchasing when the market is reaching new highs and panic-stricken investors selling when the market declines.

Lessons learned from emotions and investing:

  1. Have a well thought out financial roadmap.

  2. Review the roadmap during both good and bad market cycles.

  3. Ask yourself, “Other than my emotions and the market, has anything changed with my financial plan and goals?” If not, stick to the plan. If things have changed, let’s talk.

  4. Historically, selling investment to relieve anxiety about the markets can be costly.

Summary We know the markets will surprise us.  The consensus estimates of “where the market will go and why” are most often wrong.  History will not repeat itself in the market the same way, but we can learn a lot from both historical data and behavior.

When the market is volatile, particularly when it’s in decline, it can be unnerving for many investors. The concept of “buy and hold” never sat well with me. I prefer “invest and assess.” Whether in stocks or bonds, investing has to be with a purpose and a plan - period.  Our team’s work is to serve you by synthesizing your information into a plan with a purpose. Having the plan in place, we practice “invest and assess” with the goal of offering you confidence in how your plan will play out both in and through retirement.


Related Articles

How to Stay Positive When the Market Gets Negative
 

When investors experience market turbulence, it’s never fun. It’s a lot like being on a plane when the fasten seatbelt sign goes on and the wings of the craft start flapping like a bird in air. Our investment firm has experienced 30% of the worst days in the market since the year 1899, so we’ve endured our share of turbulence. The purpose of this note is to address participants investing in their 401k plan and to share lessons we’ve learned from the past.

  1. Participants should understand what is “normal" turbulence in the stock market. A correction (aka turbulence) is typically defined by a decline of 10% or more with a “bear market” declining 20% or more. Although corrections and bear markets never feel good, they should be considered normal and expected. In the last 85 years, there have been 51 corrections or bear markets. In the last five years alone, we’ve had six periods of declines of nearly 8% or more. In short, normal never feels good but normal is normal.

  2. As the Dow Jones has increased in value from the year 1987 (1,793) to today (16,000), the drops in point value don’t have the same impact as in earlier times. Take for example the one day crash in 1987 where the market lost 8% of it’s value in a single day with a 156 point drop. If that same sort of drop were to occur today, we’d need to see a 1,600 point plunge. The bigger number seems scarier on the surface but its impact as a % loss on the portfolio is the same. Put another way, 156 point drop today would not even be a 1% drop…

  3. When thinking about what to do when turbulence sets in, participants MUST think about their personal timelines for their money. In most cases, for someone 50 years or younger, you’ll have 15+ working/investing years before retirement. During those 15 years you get the benefit of being able to buy into the market as it declines. Ultimately, without having to think about it, you are buying lower with the hope that the shares you are purchasing NOW will be worth more in the future. For those nearing retirement, the question about what to do is a bit more complex. At or near retirement making sure you have adequate cash and safe investments to cover living expenses is everything. Having several years worth of living expenses put aside in CD’s, cash, or money markets makes a ton of sense. This enables you to hold onto the stock or equity investments you have until the turbulence subsides.

  4. Managing your emotions during the turbulence is wise. Much like unbuckling your seatbelt and walking around the cabin during a rough flight, making snap decisions about your 401k during turbulent times can be dangerous to your financial future. Again, although it does NOT feel good when the market(s) get choppy, acting prudently and slowing down can greatly benefit you and your retirement funds. One of the many benefits of being a Human Investing 401k client is access to our 8am-5pm Monday to Friday call in line. One of our advisors can walk you through all your options as well as give you advice based on your specific account. In the end, whatever you opt to do, your decision will be well thought out, informed and discussed.

There are many important lessons we’ve learned from the past. This note is intended to take those lessons and to provide you with some perspective and thoughts on how you might want to approach volatility in your account. In the end, if you have questions and want to talk it over with one of our advisors, please call us as we would be happy to hear from you.


Related Articles