Posts in Economic Commentary
The Big Short: Volume II Starring $GME
 
image.jpg

Last week GameStop went viral as a topic unlike anything I’d seen in my 10 years at Human Investing. Probably just like you, I googled “Gamma Squeeze”, had someone two degrees of separation from me divulge they had been a part of wallstreetbets, and now have significantly more money, and felt like I was watching a version of March Madness play out real-time in the financial markets.

With the introduction of free trading and the gamification of trading stocks with apps like Robinhood, this past week was the culmination of many factors colliding (more on that later). Different than in The Big Short (2008 Real Estate Crisis) where select hedge funds were taking advantage of large investment banks being overleveraged in the housing market, this time it was retail investors taking advantage of hedge funds overleveraged in GameStop. If Michael Lewis or someone else isn‘t writing this book already I’d be shocked, and I can’t wait for the movie too.

Most of the questions our team has been fielding this week looked like a version of:

  • Why GameStop?

  • Why now?

  • Explain this to me like I’m 5

  • Is this a one-time occurrence or is something like this going to be happening more frequently?

  • And probably most importantly what does this mean for me, my investments, and the markets as a whole?

To help me answer some of these questions I’ve enlisted our head analyst, Andrew Gladhill. In our office known as Glads. For those of you who haven’t spoken with Glads or seen his work, he’s a CFA and anyone who knows him would most likely have him on their Who Wants to be Millionaire “phone a friend” shortlist. Maybe most importantly, one of the ways Glads makes our team better is being able to take complex topics and break them down in very digestible terms. Take it away!

Some key terms you need to know

Shorting

The short answer: Shorting is betting that a price will go down (not up), and you benefit as the price goes down. For example, if you short a stock trading at $20, and it goes down to $15, you have made $5.

The long answer: Shorting works through a few steps:

  • Step 1 – you borrow the stock today from someone who holds the stock (Let’s call them Emily) with a set date you must return the stock back to Emily. Emily lends you the stock because Emily charges you interest.

  • Step 2 – you sell the stock today (say for $20)

  • Step 3 – you must return the stock to Emily, plus interest (say $1) buying it at the current market price to do so (say $15)

  • In this example, you have made $4 (Sold for $20, bought for $15, charged $1 interest)

Why do you short? Because you believe something is overvalued, and you want to profit from when the price goes down.

short-selling copy.jpg

Short Squeeze

The short answer: When a shorted position has the price increase, those who are shorting it (the shorters) are forced to buy the position, driving the price up further.

The long answer: If the price rises on a short position, the shorter starts losing money. They can either hedge their losses by buying the stock before the return date, or wait to buy and hope the price falls. Remember, the shorter must return the stock to the original owner by a set deadline. Because the price of the stock can rise higher and higher, the shorter’s potential loss is limitless.

So a short squeeze is when the price of a company goes up because lots of people are buying a heavily shorted stock, increasing the price. The rise in price causes some shorters to close out their positions, which involves buying the stock. More buying activity causes the price to increase, causing greater losses for the shorters. If the price rises high enough, the losses get large enough that more shorters are forced to close out their short position to avoid having their total portfolio value go negative. This creates a positive feedback cycle of buying activity, pushing the stock price even higher.

cycle.jpg

Why WAS Gamestop ($GME) TARGETED?

The Short answer: GME had an unusually high amount of shares sold short, allowing the short squeeze to be possible. Retail investors gathered online & decided to try to make it happen.

The Long Answer: Short float is the number of shares sold short (borrowed & then sold) that have not yet been repurchased. Gamestop had a short float over 100%, meaning some shares of Gamestop had been lent out more than once. This happened because many believed Gamestop (a retail video game store) was the next Blockbuster and would go out of business. The share price would go to $0 a share, and they would profit from the price dropping. Some retail investors noticed the high short float on GME in an online community known as reddit wallstreetbets (aka WSB, aka retail investors). The retail investors saw an opportunity for a short squeeze due to the large short interest, and GME being a relatively small company.

The retail investors planned to force a short squeeze on GME. The retail investors would buy up as many shares of GME as possible, driving up the price. The retail investors would hold their shares, drying up the supply, pushing the price up even further. All this upward price movement would force a short squeeze, driving the price up even further, and the positive feedback cycle would result in astronomical price increases for GME as the short squeeze hits. Retail investors will be able to sell their shares at high prices to the shorters forced to closing out their position.

Why was trading restricted?

The short answer: Companies that execute trades (brokerages, i.e. Robinhood) must have money to cover trade differences with clearing firms (the back end companies that finalize trades) as collateral. The rapid, unexpected movement in GME brought some brokerages ability to do that into question, and they had to pause the trading until they could secure more funding.

The long answer: When you sell or purchase a stock, that trade isn’t finalized until settlement, which is 2 days later. This time is used to verify the transfer of cash & the security purchased. It’s like when you deposit a check at the bank, the bank makes sure the check clears before you can withdraw cash. Clearing firms finalize stock transactions. The brokerages (i.e. Robinhood, Fidelity, Schwab, e-Trade) are required by law to maintain cash deposits as collateral with clearing firms to cover any losses. The required deposits by the clearing firms for the brokerages went up because GME was having higher price volatility. Some brokerages had to pause trading in GME while they secured enough funding to make the deposits required by the clearing firms. The financial system rarely handles meteoric rises in stock prices in such a short amount of time, and certain parts of the system that normally work so smoothly we never think about them suddenly brought trading to a screeching halt.

what does this mean for me and my portfolio?

Thank you, Glads. This story and its ramifications are certainly not finished. As more details come out it will continue to paint a clearer picture of what it means for investors over the past week and looking forward as well. To bring this all home and answer the question, “what does this mean for me and my portfolio” a few thoughts:

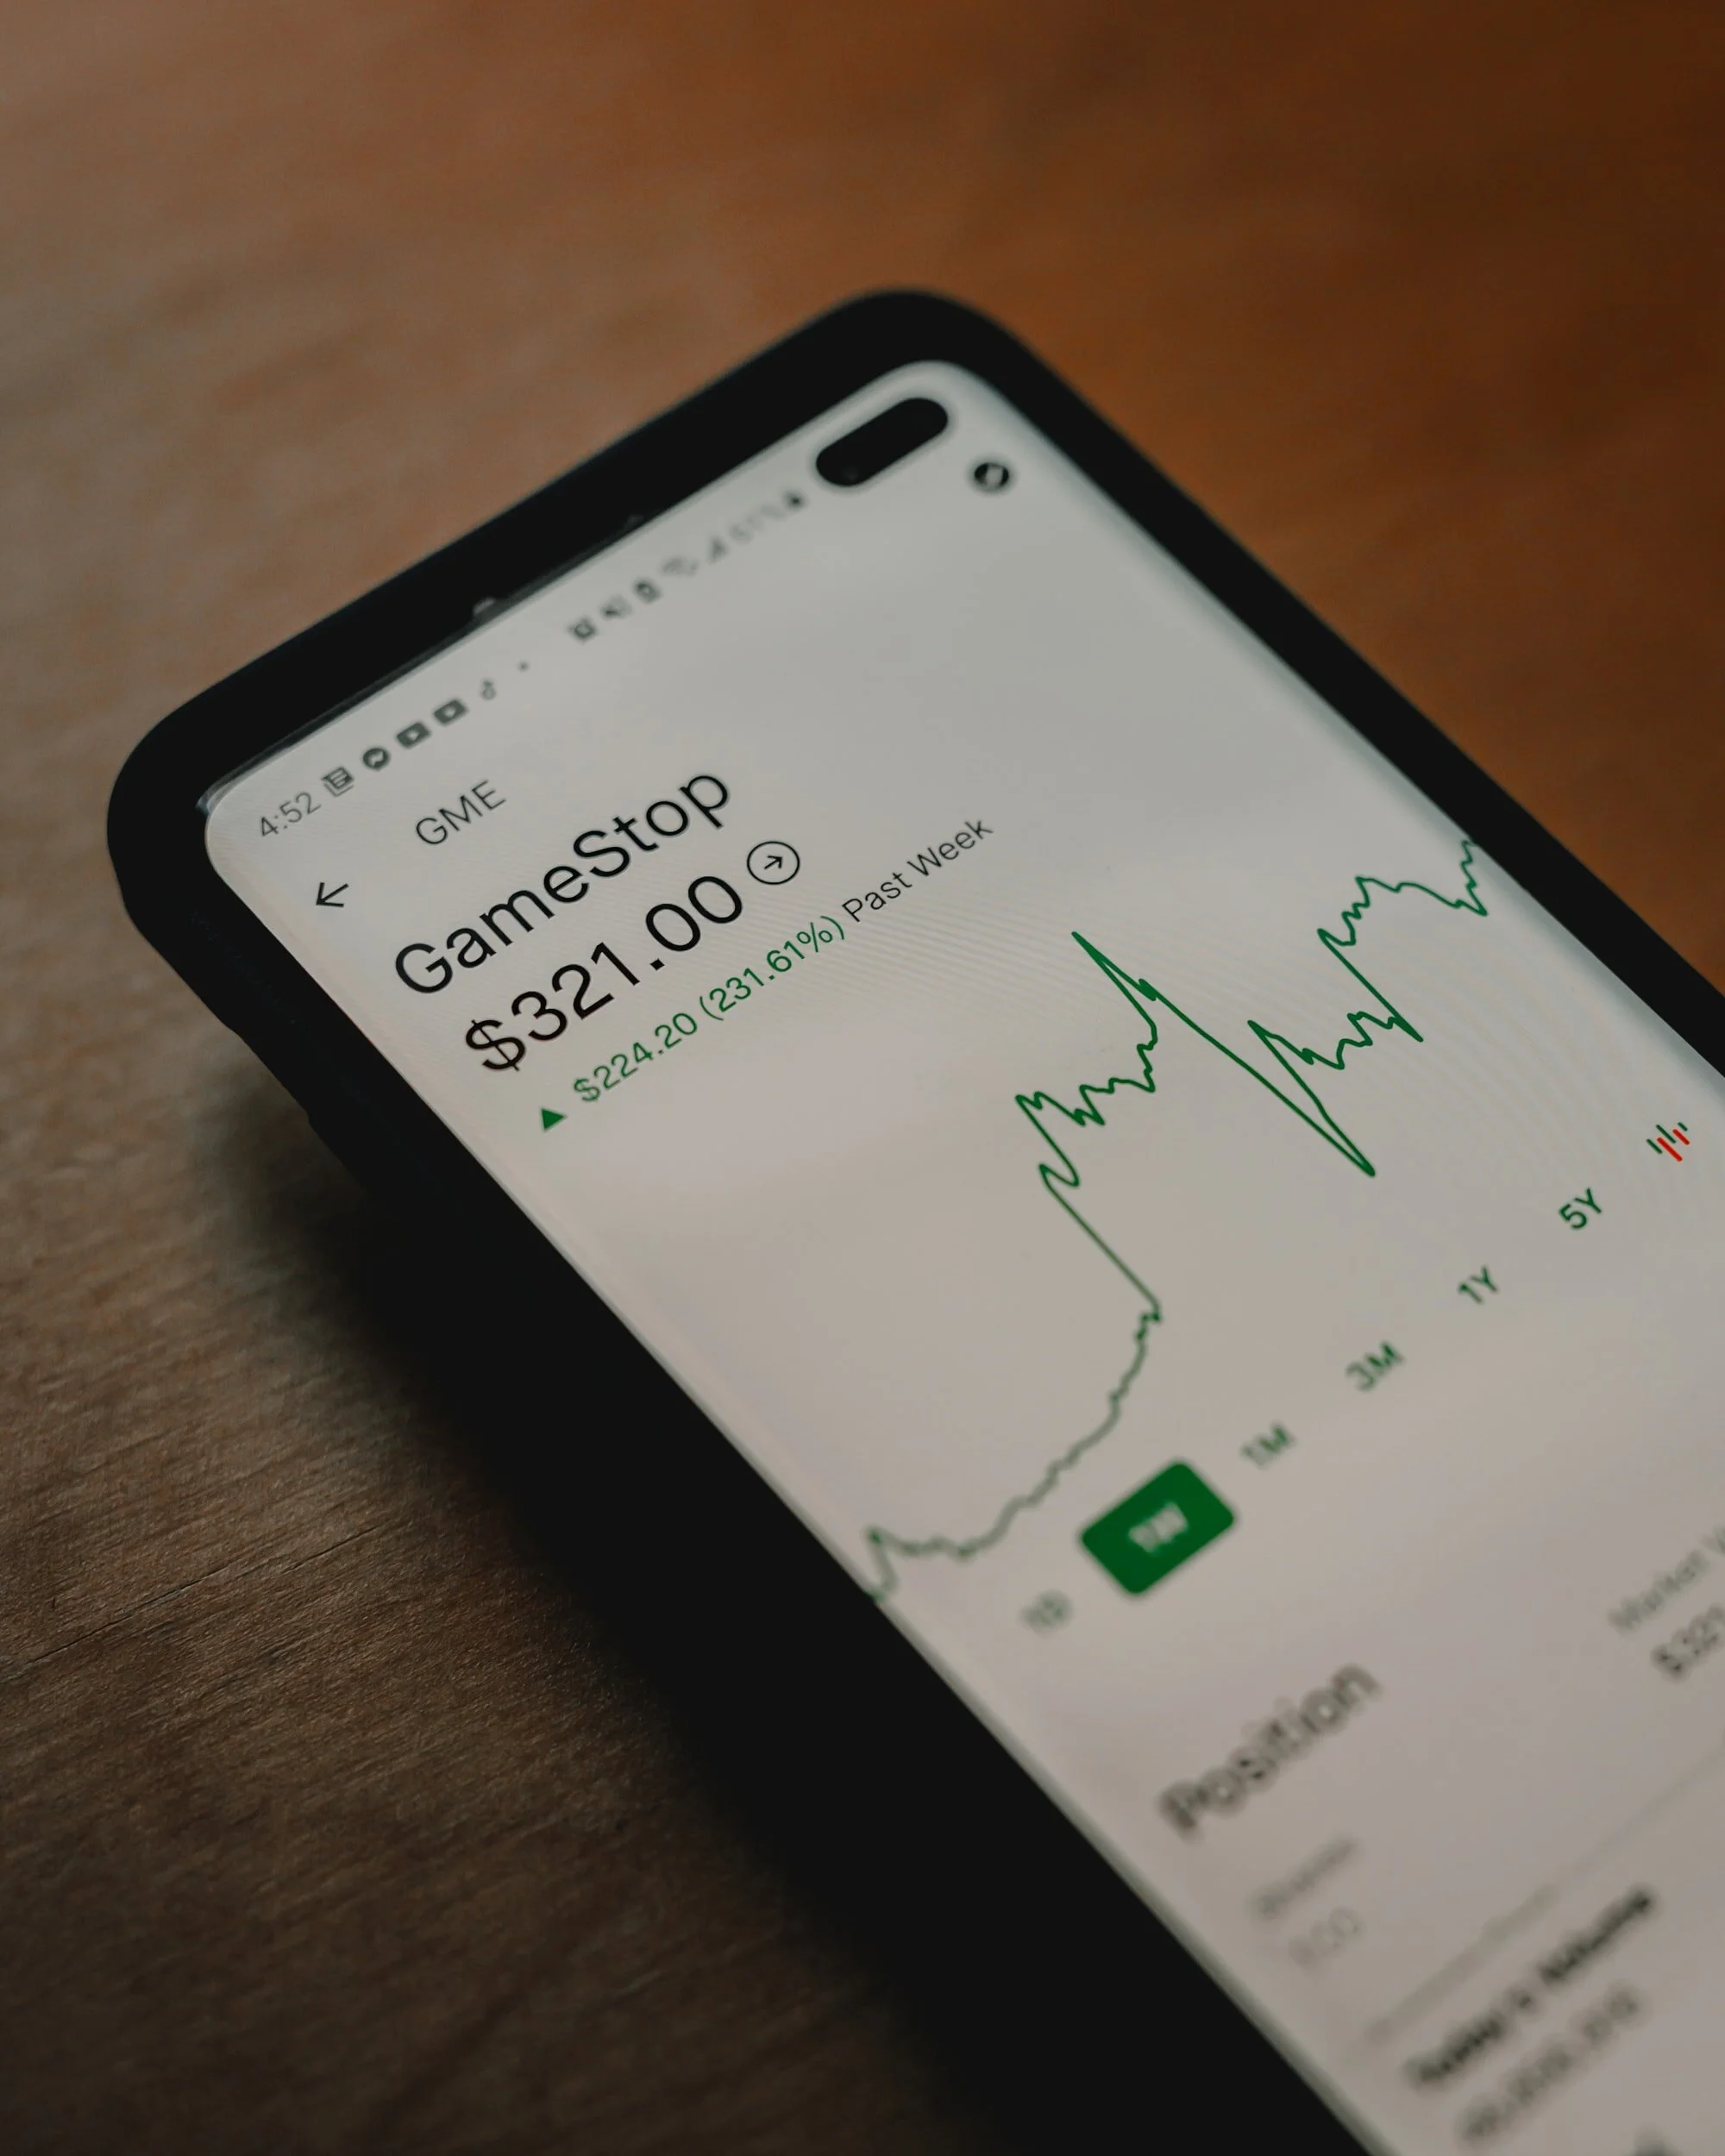
While Gamestop took up all the headlines this past week, for most investors it had little to no impact on their portfolio. For example, the Vanguard Total Stock Market Fund (VTI), is a staple in many retirement accounts across the country, the fund was down 3.59% last week (in line with the market). GameStop contributed a positive 0.04% return to the fund (basically nothing!) despite being up nearly 655% on the week, a bi-product of how small of a company GameStop is relative to other companies in the fund that truly move the needle.

vanguard.jpg

So should I get in?

Should you open up a trading account in preparation of the next public short-squeeze? The boring/correct answer is this is not the forum to be giving specific financial advice for your specific situation. If you’re truly speculating about that and want to talk to it through, PLEASE sign up for a Calendly link with one of our advisors and they are happy to talk with you about it.

My favorite book I’ve read in the past few months is The Psychology of Money by Morgan Housel. It’s one of the best (in my opinion) personal finance books because it focuses on behavior (potential controllable actions) rather than guessing what’s the next best stock is. He has an entire chapter devoted to the topic of, “People have a tendency to be influenced by the actions of other people who are playing a different financial game than they are.” This is the case for most people saving for retirement when thinking about GameStop, shorting, and what we’ve seen in the news. It’s Human to feel like you missed on an opportunity with GameStop and to want to hit it big on the next trade. But most likely that’s not your game.  Most likely your game (and mine too) involves saving and investing for a long time, letting compounding interest take care of the rest, and maybe most importantly staying out of your own way. And while that game doesn’t create the same headlines, as Housel writes in a different chapter it can create a different type of headline to aspire to.


Related Articles

How Some Millennials are More Resilient during Financial Shocks
 

According to most research, although millennials are considered the most highly educated generation, we are the least informed when it comes to our financial decisions. Not only do we lack financial literacy, but pre COVID-19, 63% of millennials felt anxious when thinking about their financial situation, and 55% felt stressed when discussing their financial situation. I imagine COVID-19 has negatively impacted those figures even further.

There are many factors that affect our personal financial stress levels, but historically, the financial industry has felt inaccessible to those who lack financial literacy and/or feel insecure about their financial situation. How are we supposed to learn if we lack access to knowledge?

SAVINGS APPS TO SAVE THE DAY

I love the concept of savings apps, because it improves accessibility of investing and saving for a large population. Basically, if you have a smart phone and a few extra dollars, you can be a saver. A study conducted in 2019 found that individuals who used savings apps kept better track of their finances and were more resilient when faced with a financial shock. However, accessibility without education can be hazardous. So, here are two recommended savings apps that provide learning and saving opportunities.

  • Mint is a free app powered by INTUIT (think Turbo Tax) that houses all of your financial information in one place. Mint uses a holistic view and budgeting tools to find extra savings for you. Not only do they provide you with custom savings tips, but they also have a hub of resources, ranging from building a grocery budget to investing advice, so you can learn along the way!

  • Digit has the same philosophy as Mint: find savings within your current financial situation. With this philosophy, Digit analyzes your current income and expenses and then lets you know what you can afford to save. They invest your dollars in FDIC insured account using a portfolio based on your risk level and comfortability. You are also able to attach these savings to a specific goal – emergency savings, honeymoon, a doggo—you name it. There is a monthly cost of $5, but you do receive 1% annual bonus savings every three months.

NOT FEELING IT? FOLLOW THEIR SAVING PHILOSOPHIES

It’s okay if you don’t vibe with the savings app world. But if you do want a better grip on your finances, follow the philosophy behind the savings apps:

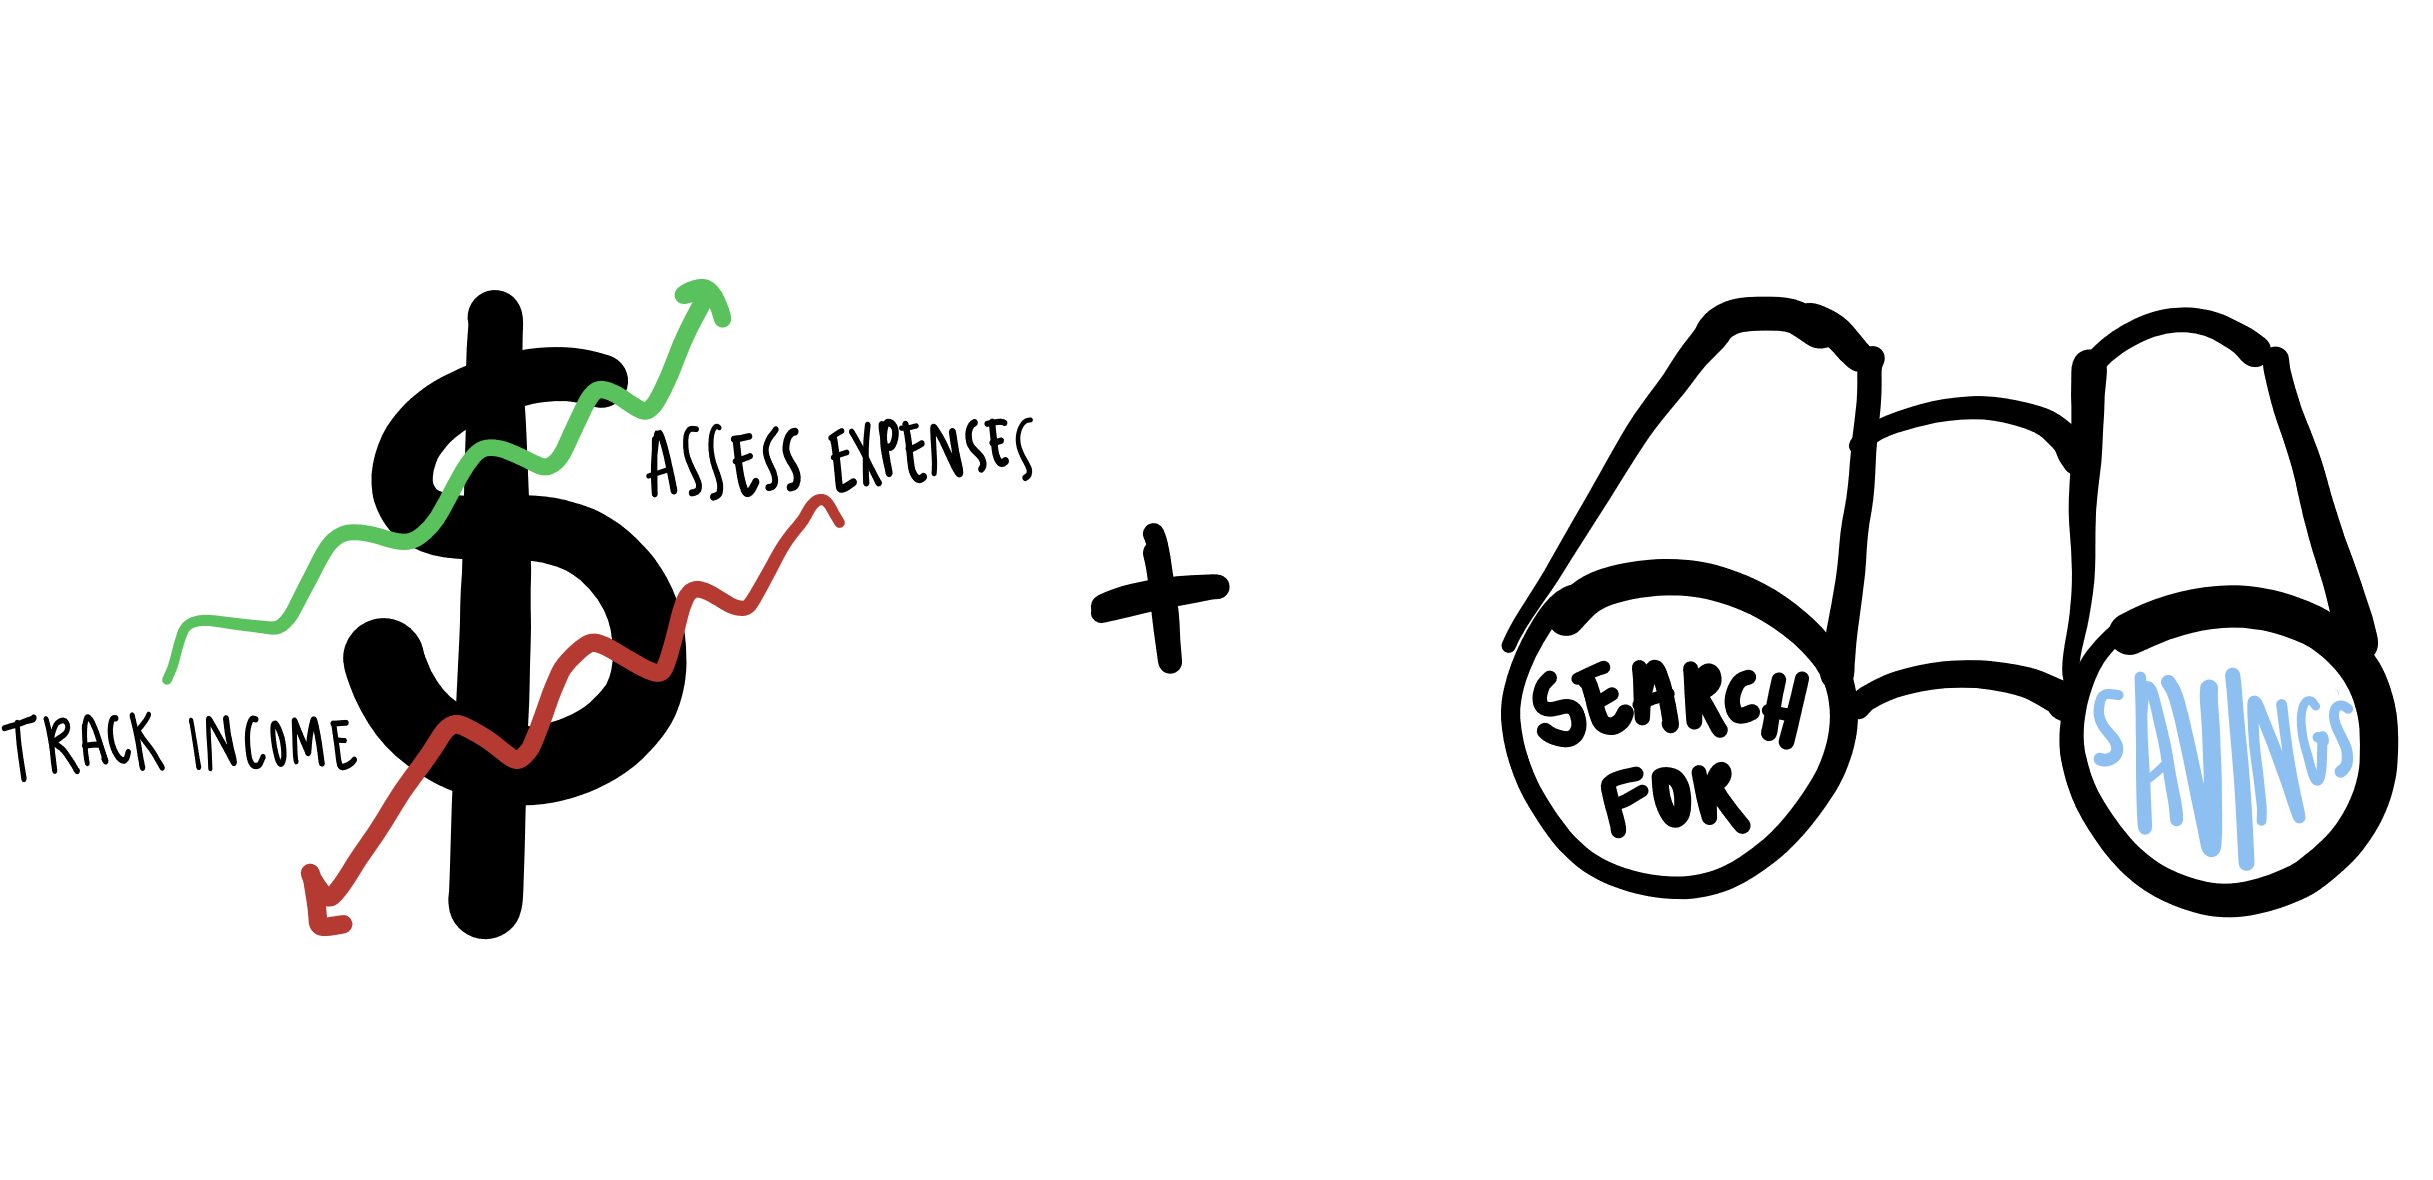
  1. Keep track of your income.

  2. Assess your spending habits.

  3. See where you can save.

savings blog doodle23.png

For me, that looks like walking past the gluten-free bakery every so often instead of into it (which is usually the case) and saving the extra $5. At the end of the month it can make a difference (Don’t believe me? See how much you can save by ditching your morning coffee here).

Finally, allow yourself to interact with financial resources without being too hard on yourself. The purpose of these apps is not to be a report card. The purpose is to empower you to make thoughtful decisions that will improve your financial health. If you have questions, check out our Financial Wellness Center or reach out! We are here for you.


Related Articles

Charts of the Year
 

As 2020 comes to an end, our team is sharing seven charts that help summarize some of the puzzling financial activity we experienced this year. We have been including these charts in our group education meetings as visual aids to help explain 2020’s market volatility. For the readers who did not attend one of these meetings, we made this post for you to reference in the future.

1 sp500.jpg
2 sp500.jpg

2020 was a year that represented a disconnect between the stock market and the economy for many investors. On one hand, the stock market (represented by the S&P 500) is up over 14% this year. On the other hand, many local businesses and industries have been devastated by the pandemic. Investors had a difficult time sorting out those two facts, especially between late March and September.

In order to rationalize 2020 market returns, we look to the five largest companies in the S&P 500 (in chart 1 and 2) that have led the charge in terms in performance. Specifically, these five companies are Microsoft, Apple, Amazon, Google, and Facebook. Compared to industries like airlines, hotels, and restaurants, these five companies were able to offer services and be agile in the pandemic. Couple that with those five companies making up over 21% of the stock market (the largest piece of the pie chart in the last years) and you can create a narrative of why the market has performed well while areas of the economy have struggled.

3 robinhood.jpg

Repeat after me, past performance does not guarantee future results. It’s important to remember that now more than ever because 2020 produced some impressive returns. Combine that with 2020 being a year where Robinhood investors, or in other words younger investors who had more free time on their hands, became interested in the stock market, options trading, crypto currencies, and other investments. What’s interesting about 2020 is that many of the names or asset classes that people are familiar with or use every day happened to be some of the best performers of the year. Years like this don’t always play out this way, but Peter Lynch’s quote of “Invest in what you know” certainty paid off this year with individual’s taking products that they own/use frequently and investing in them. The above provides a sampling of some of top performers of 2020. As you can see you probably interact with of these line items daily. 

4 sp500.jpg

While what we have experienced nationally (and globally) this year has been unprecedented, in the context of the last 40 years of market returns it is not abnormal. Since the start of 1980, the S&P500 (excluding dividends) has returned an annualized 9%. Despite having average intra-year drops of 13.8%, the market has finished positive 75% of the time. Short-term market volatility has paved the way to long-term investment returns, and 2020 has proven no different.

For us investors, this is a reminder to remain invested through the market turbulence. Patience is a requirement for long-term success. Warren Buffet said it best with his quote, 

“The stock market is a device for transferring money from the impatient to the patient.” - Warren Buffet

5 sp500.jpg

This chart illustrates the consequences of hitting the “panic button” when we experience market turbulence. If we buckle up and hang on tight, there is potential to see long term growth versus throwing on the parachute and cashing out (hitting that proverbial panic button). 

6 interest rates.jpg

Opportunists unite. With historically low interest rates, many people have taken this opportunity to refinance their mortgages. By refinancing their mortgages, individuals and families have improved monthly cash flow, decreased the amount of interest paid over the life of their loan (often saving tens of thousands of dollars over a 15-, 20-, or 30-year period), and shortened the length of their mortgage. To join the rest of the opportunists, see our post Refinancing Your Mortgage: A How to Guide

7 unemployment.jpg

In March alone, the number of initial unemployment insurance (UI) claims increased by more than 3,000% as businesses closed to slow the spread of the coronavirus. People have suffered this year, and none of us will look back at this time and wish we did less.

This graph focuses on unemployment, but we know that hospitalizations, closures, and fear also increased in the first half of 2020. In a time of desperation, our communities responded to the suffering in an inspiring way. Specifically, the number of small charitable donations ($250 or less) increased 19.2% over the first six months of 2020 compared to 2019. You know someone who has been unemployed this year, and you also know someone who used dollars to alleviate some of the widespread grief.

We hope these visuals help you digest some financial information from this past year. We don’t know how 2021 will unfold, but we do know that market timing is dangerous and most of the time impossible. Staying the course is candidly a boring investment strategy, but one that typically yields the best results.  


signature-HI Team.png
 

Related Articles

When Market Crashes are Like Rock Climbing Falls
 
brook-anderson-gTQbZXL417Q-unsplash.jpg

“Am I okay?” Fear ripe in my voice. 

We just heard what no climber ever wants to hear: one loud scream, three thuds, then nothing.

At that moment, I was sixty feet in the air doing the routine work of cleaning the anchor, removing all the gear that protected us as we climbed up the route and re-setting the rope to be lowered and move on to the next climb when we heard it.

That sound? It was someone falling. Hard. We didn’t know how far or how badly, but we knew that climb was higher than mine: about eighty feet top to earth.

“I got you!” He called back. “Take a deep breath. Tell me what you’re doing.”

I did. I called out every single step I was taking to clean the anchor and secure the rope back to my harness –triple checked for safety – and he held the rope. Eventually, my feet and wobbling legs arrived safely back on earth.

When you rock climb, there is obvious risk involved. Risk that you accept as the price of admission for moving higher than twenty feet – the height where, if you fall, you most likely will not be fatally injured. 

Confidence matters. Confidence in your gear, skill, weather, and your risk tolerance. Yet there is a confidence that is as important – if not more important – than all the confidence inside you: that is confidence in your belay partner.

Your partner is the one on the other end of the rope, your safety line, whose responsibility it is to pay attention, catch you when you fall, and lower you safely from sky to earth. A good belay partner must not only know the mechanics of climbing and safety but must also know you. They communicate clearly and are always paying attention – often mitigating the risks that are out of your control when you chose to leave the earth and head toward the open blue.

At no point after hearing those falling sounds did anything feel ok. My imagination was a wild hostage situation, forcing in front of my focus nightmares of gear failing and my body hurling through space.

But in reality, I was okay. I was safely anchored.  We had a plan and practice in place for climbing safely. My belay partner was paying attention, “I got you”. He heard the sounds too, but he did not take his focus off the rope and my safety.

Investing in the stock market can be a lot like rock climbing

There is risk involved in climbing your portfolio value higher than a modest, though acceptable, goal of beating inflation.

When the market takes a dive and the media heads are talking about total economic fall-out, it sure doesn’t feel okay. Do you have a good partner? A good advisor is a good partner. 

Are they paying attention? When you hear the rumble and scary sounds of the market moving and you call out, “Am I okay?”, how does your advisor respond?

At Human Investing, we are your partner on the other end of the rope

  • Our climbing anchor is the fiduciary standard. Every trade, conversation, and piece of back-office work is done to mitigate unnecessary risk as your portfolio climbs, and it is all done with YOUR best interest in mind.

  • Our figure-eight is clean and tight.  Your financial plan is like tying the climbing rope in to your harness – it is your safety line that serves to mitigate risk by informing how your dollars are invested to avoid and securely catch any falls. When the market crashes, we are on the other end of the line. 

  • Our GriGri is loaded and locked.  We have the highest standard in investment tools.  We know our tools and we use them well, monitoring the “weather patterns” of the market, watching your portfolio as it climbs and responding as appropriate.

  • “On Belay? Belay on! Climbing? Climb on!”  Before you climb you say to your partner:  Are you ready and paying attention?  We are paying attention and ready to serve you. There is more than one set of eyes on your accounts – you are more than dollars and stock holdings to us.  We will not be distracted by the noise around us.

  • “I got you!”  As with any good partner: We know you.  We will respond to fear or a fall.  Your time with us is invested in discussing your goals, your values, and your reactions when your portfolio climbs or lurches.  We answer when you call, and sometimes we call you first because we also hear the sounds of the news and peers, and it may be scary. But in the end, we “got you.” We will not allow a fall-fear to inflict avoidable loss.

If you would like to talk to an advisor about how to climb your portfolio the Human Investing way, give us a call or send us an email.  It would be our pleasure to partner with you.


Related Articles

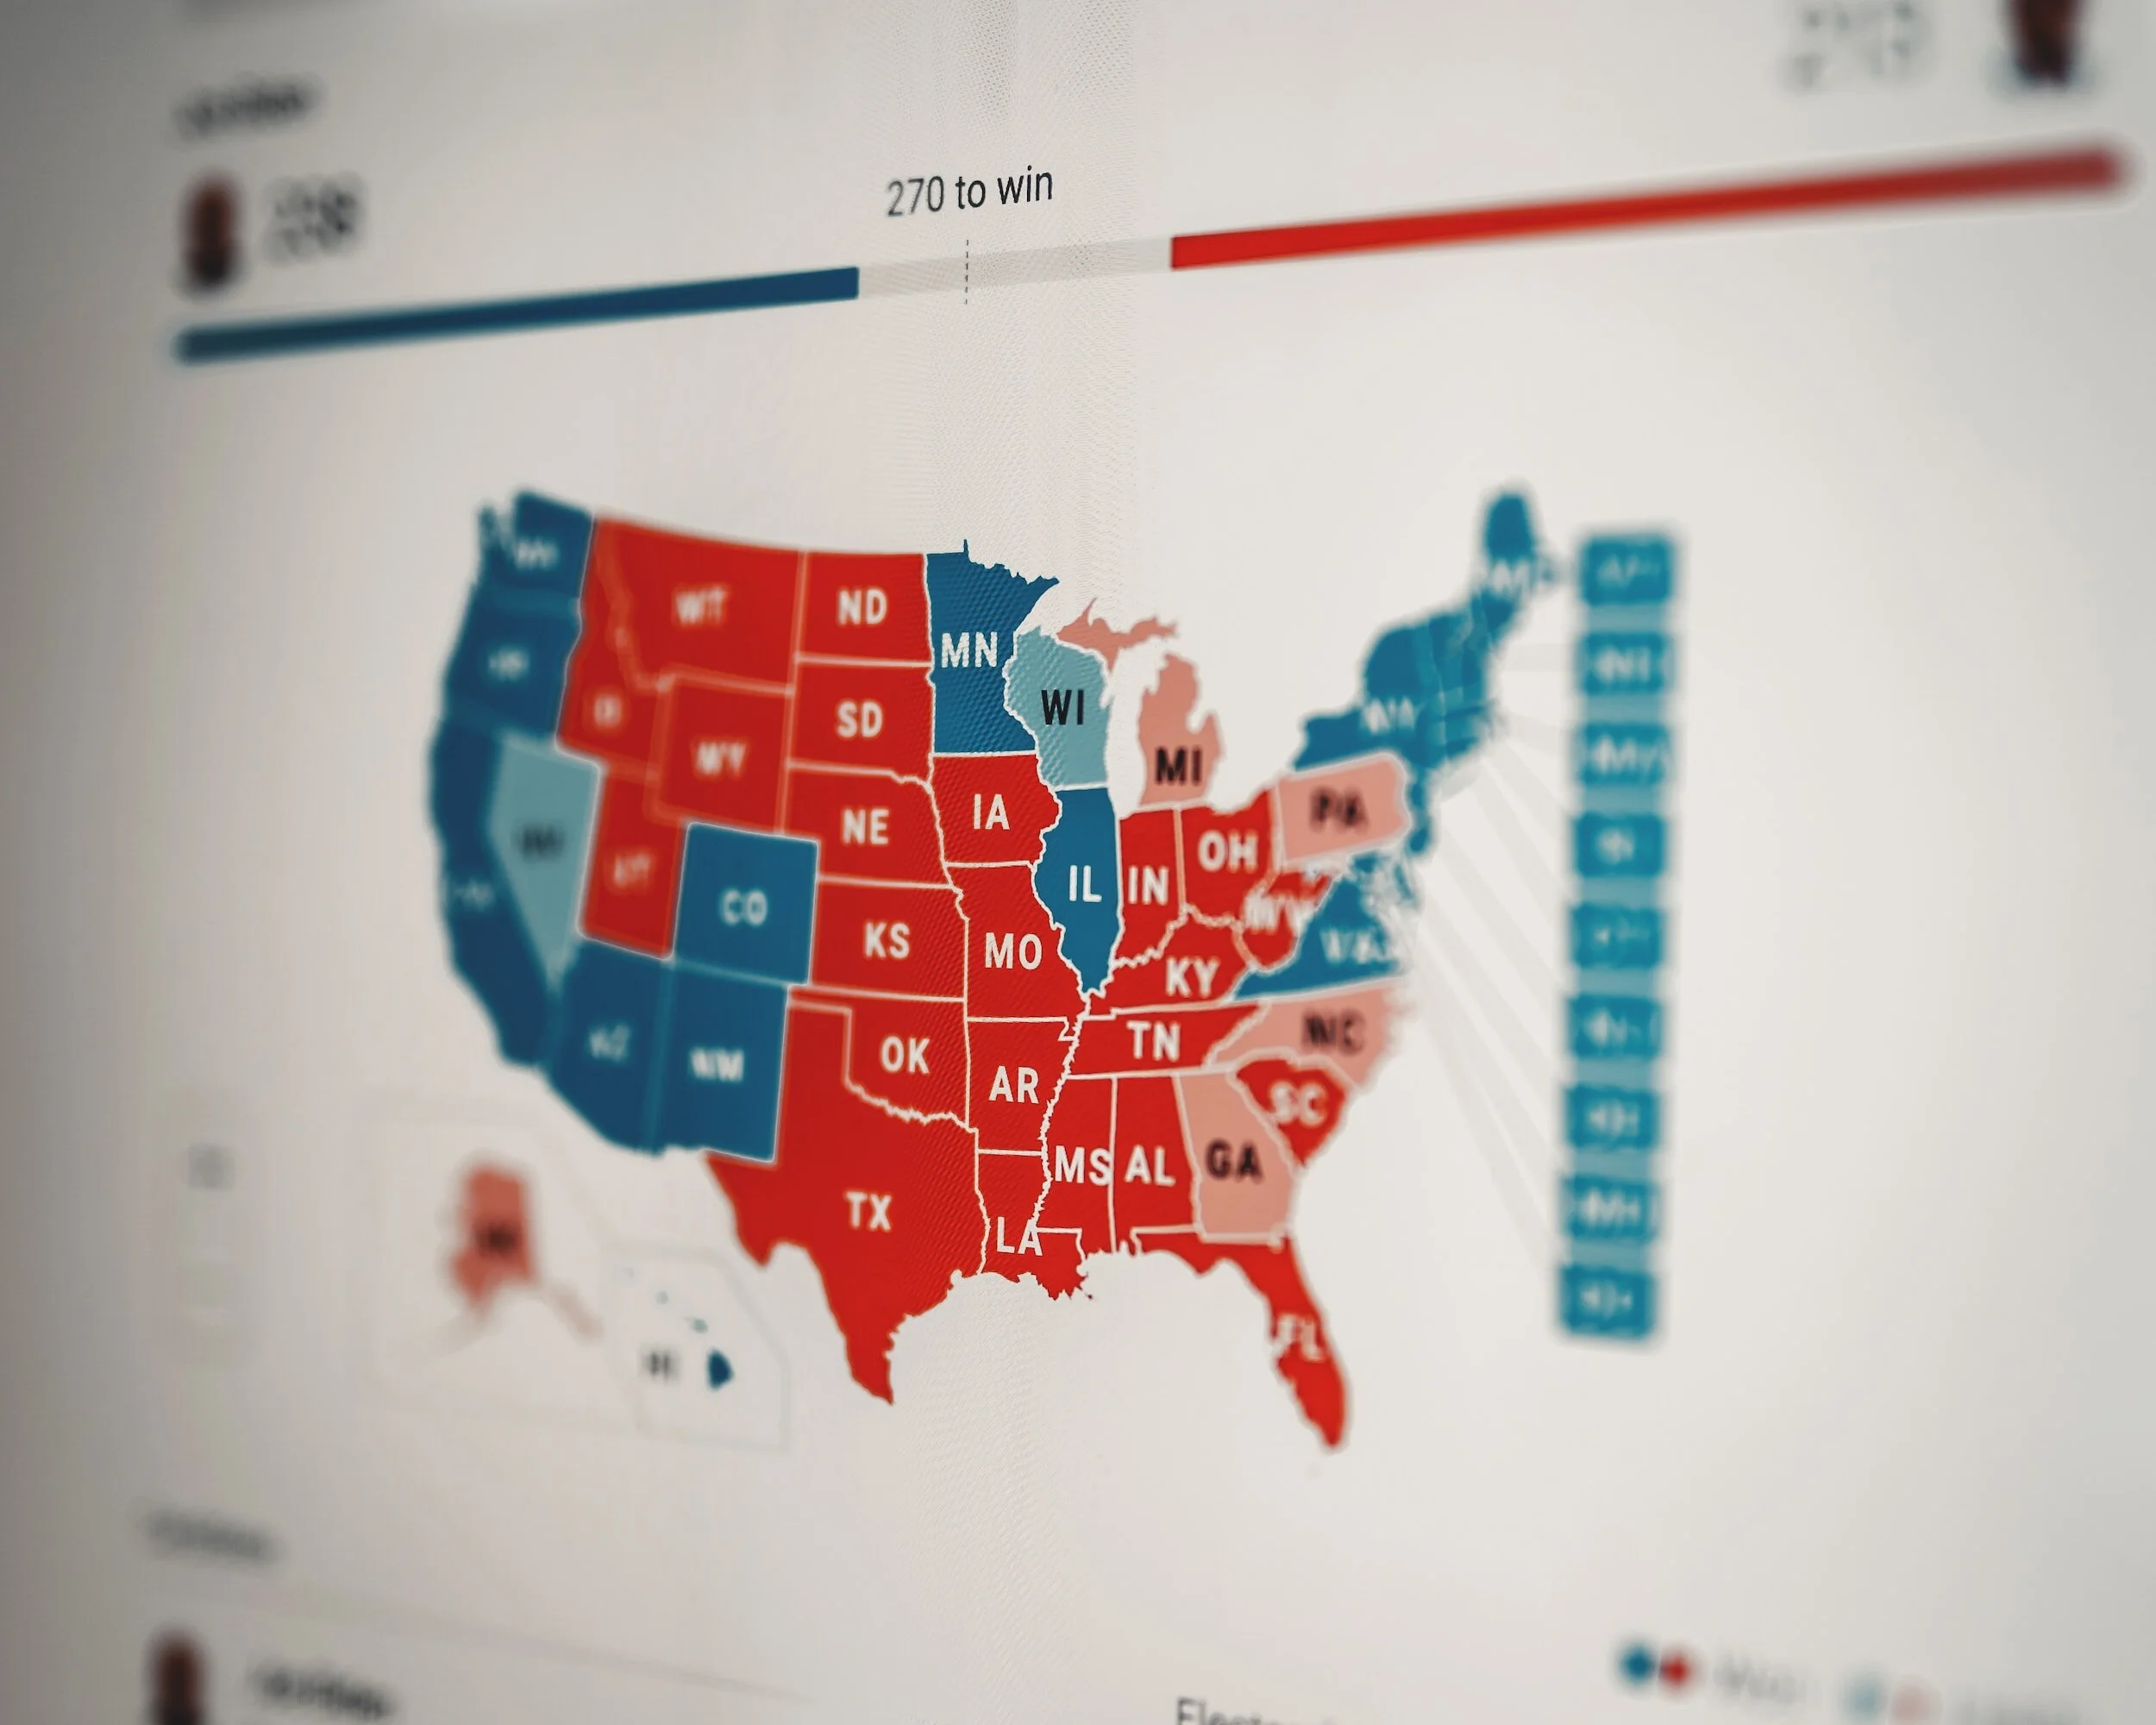
How do Elected Governments Affect the Stock Market?
 

Every four years, our clients are eager to talk about the election’s influence on their portfolios and the broader economy. And, as has been consistent over the last 20+ years, our response is dreadfully dull. Let me explain.

Generally, the stock market is apolitical, showing no preference to either Republicans or Democrats (Li & Born, 2006). Historically, Democratic administrations are associated with more expansionary policies. With a more inflationary approach in mind, Democratic administrations are also more inclined to juice the economy with Gross National Product expanding at 5%, versus 1.2% for a Republican administration in their first two years (Alesina & Sachs, 1988). 

The market cares little about the president, the Senate, or the House. As Figure 1 below highlights, an investor who placed $1,000 into the stock market beginning January of 1926 amassed significant wealth, regardless of the political leanings and party affiliation of the President. 

Figure 1

Figure 1

You might be thinking, “but this time, it’s different”. Probably not. The chart above includes years with impeached presidents, wars, crisis, and plagues, and as you can see by growth over time, the stock market cares minimally about these events. Don’t just take my word for it. Read history and periodically look at Figure 1 as a reminder.

The data we have reviewed suggests that there is almost no evidence connecting stock market performance (good or bad) with a president and their political affiliation. Consequently, households should focus on their financial plan and the rate of return necessary to achieve their goals, and less about the election and its impact on the market. 


References

Alesina, A. and J. Sachs, 1988, Political parties and the business cycle in the United States, 1948–1984, Journal of Money, Credit and Banking, 63–82.

Li, J., & Born, J. A. (2006). Presidential election uncertainty and common stock returns in the United States. Journal of Financial Research29(4), 609-622.


New Standards Set by the SEC on Transparency and Conduct for all Advisors
oliver-schwendener-uOGG7PerNf4-unsplash2.jpg

Human Investing is celebrating. Why? We have good news for you. While we’ve always been transparent at Human Investing, the rest of the industry is now required to catch up.

A new rule took effect on June 30th, designed to help provide investors with a transparent look at their investment professionals.

The U.S. Security and Exchange Commission (SEC) enacted the Regulation Best Interest rule which requires all Advisors and Brokers to provide their retail clients with Form CRS (an acronym for Client Relationship Summary).

Our firm has been promoting transparency with our clients for a long time. As a fiduciary, that’s what we stand for. We have experienced transparency leads to greater trust and better results with our clients and within our team. We are now excited to see that the rest of the industry is required to do the same. If you are working with an advisor, or plan to work with an advisor, this impacts news for you.  

The intent of the Form CRS is to address the first PILLAR of the SEC’s three-part mission:

  1. Protect investors 

  2. Maintain fair, orderly, and efficient markets 

  3. Facilitate capital formation 

Regulation Best Interest and Form CRS were created with the intent to help investors protect themselves. Form CRS accomplishes this by requiring advisors to communicate information that an investor should know (e.g. conflicts of interest and how your advisor gets paid) in a clear standardized format. This new rule isn’t a panacea for all industry ills, however, the transparency provided by Form CRS will help investors better educate and protect themselves.   

We also hope that transparency will affect wide change in our industry for the benefit of the investor. The impact of transparency we hope for is described well in Ray Dalio's book Principles.  

"Radical transparency fosters goodness in so many ways for the same reasons that bad things are more likely to take place behind closed doors." - Ray Dalio.  

So, what exactly will you be able to learn about your advisor via Form CRS? 

  • The types of services a firm offers — are there services they offer that you aren't receiving?

  • The fees and costs you will have to pay for those services — this is especially important because there are many different fee structures

  • Conflicts of interest a broker or adviser may have — an estimated $17 billion is spent annually on conflicted advice for retirement savings in the US

  • The required standard of conduct associated with the services a firm offers 

  • Whether a firm and its financial professionals have reportable legal or disciplinary history

  • Key questions to ask your financial professional

Want to learn about your financial advisor? Here is a link to the SEC's search engine of Form CRS - Form CRS Search Engine. See Human Investing’s Form CRS here.

If you have a question about Form CRS or you are interested in having a clear, transparent conversation about your financial plan, please contact us at Human Investing.  We're here to help! 


Sources:

www.investor.gov

https://www.sec.gov/Article/whatwedo.html

https://obamawhitehouse.archives.gov/blog/2015/02/23/effects-conflicted-investment-advice-retirement-savings