It sounds bleak. And when I talk with people who are getting close to retirement, they feel the same way.
It doesn’t help that headlines about Social Security “running out of money” have become more common. And, with congress approaching a funding deadline that is no longer decades away, it's understandable that people nearing retirement want to know what that means for them.
Our team went through the 273-page 2026 Social Security Trustees Report to get a clear picture of what is actually happening. And… the future of Social Security may not be quite as grim as the headlines suggest.
The short version is that Social Security is spending more than they are bringing in, and something needs to change. But I think there is an important part of the story that gets lost in the headlines.
Running out reserves is not the same thing as Social Security disappearing. Understanding this distinction matters, especially for retirees tempted to make decisions out of fear rather than what’s best for their financial plan.
The Real Issue: Social Security’s Trust Fund
Quick background on Social Security, it is primarily a pay-as-you-go system. Payroll taxes collected from today’s workers and their employers are funneled to pay benefits to today’s retirees.
For much of Social Security’s history the taxes collected amounted to more than it needed to pay current benefits and that surplus of dollars accumulated in the current trust funds. However, today, the opposite is happening. Benefits and other program costs are greater than the revenue coming in, so Social Security is using those reserves to cover the difference.
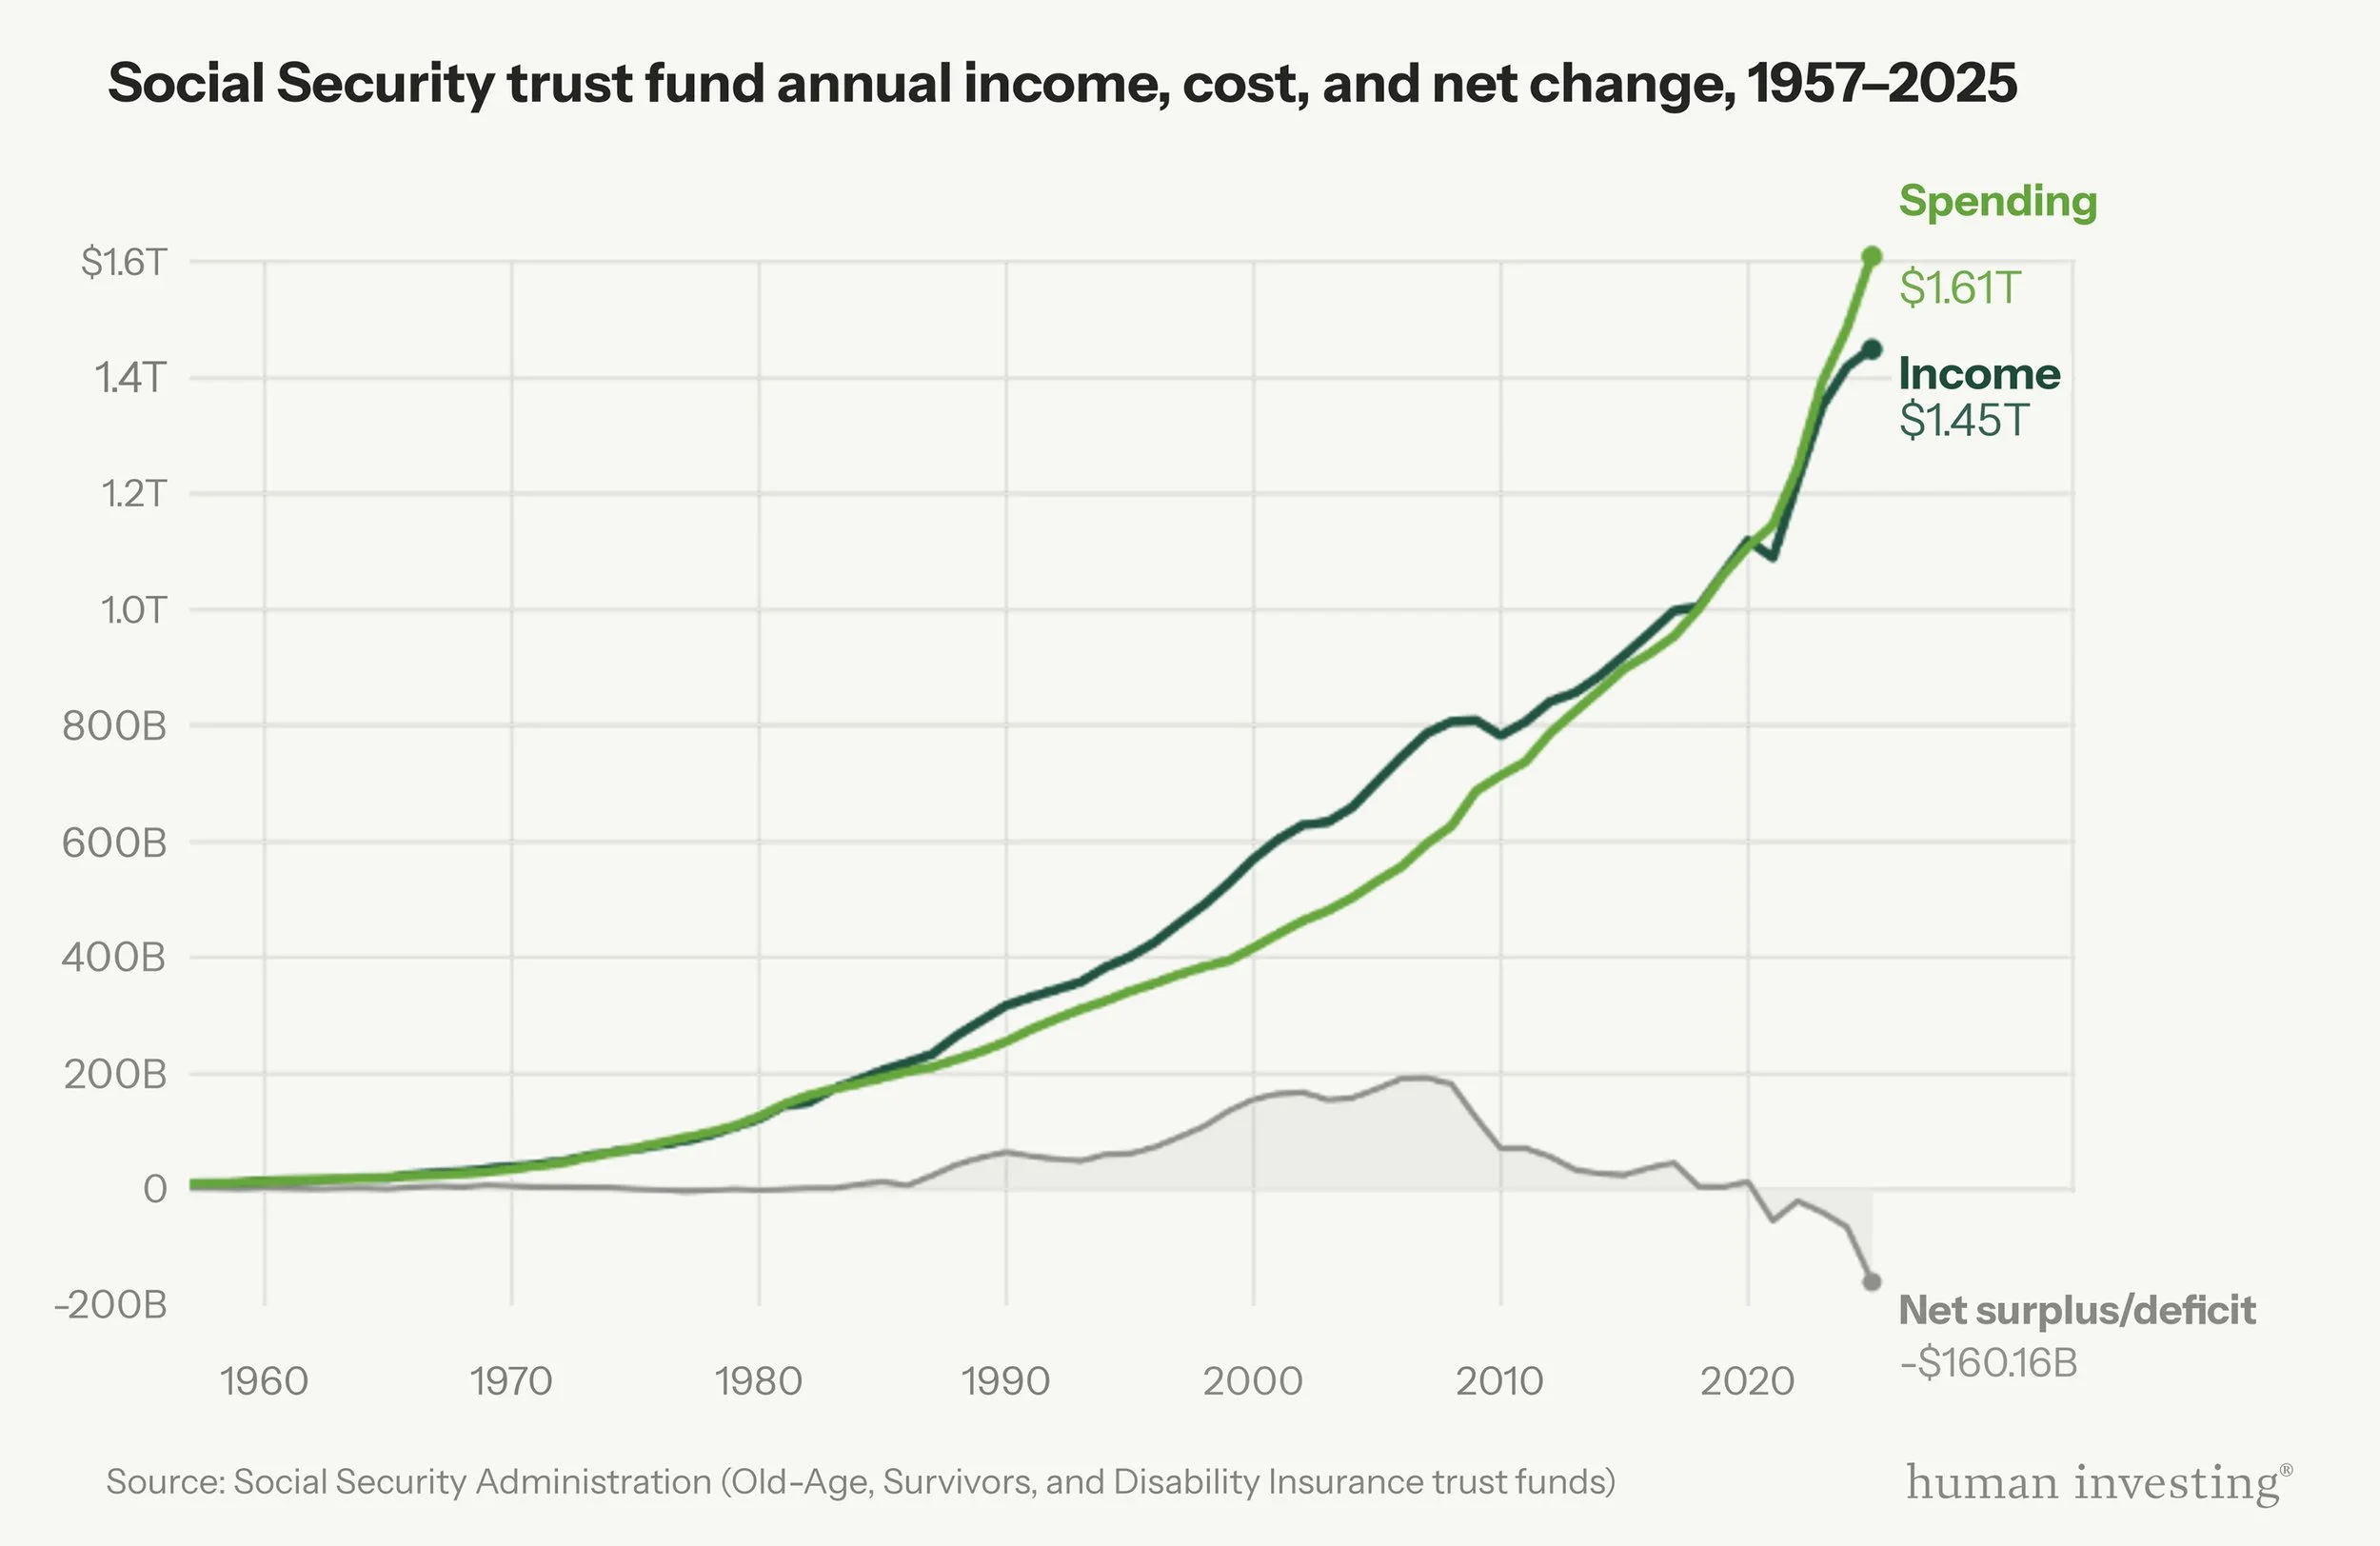
The issue comes from a demographic imbalance. Baby boomers are retiring, which leaves fewer workers to support each Social Security beneficiary. This creates a pretty straightforward math problem: benefits are growing faster than the payroll tax revenue available to support them.
Since 2021, Social Security’s total costs have surpassed its total income, requiring the program to draw down its reserves. With the current projections, the OASI trust fund, that pays retirement and survivor benefits, is expected to exhaust those reserves in 2032.
While this sounds alarming, it doesn't mean Social Security will vanish.
What Happens in 2032?
The common misconception is that the depletion of the trust fund means Social Security will go bankrupt and cease to exist.
The Social Security trust fund that pays retirement and survivor benefits is projected to run out of its reserves in the fourth quarter of 2032. If Congress makes no changes before then, the programs income would be enough to pay approximately 78% of scheduled retirement and survivor benefits ([1] pg.5).
This doesn’t mean Social Security benefits suddenly stop when the trust fund is depleted. Workers would still be paying Social Security taxes, and these taxes would continue to provide a significant portion of benefits.
I also don’t want to downplay what a potential 22% would mean for retirees. For someone expecting $4,000 per month from Social Security, a 22% reduction would mean $880 less each month, or more than $10,000 per year. This is considerable difference for someone counting on this income.
This is why I have a hard time with either extreme. Saying Social Security is “going bankrupt” overstates the problem but saying there is nothing to worry about understates it.
Congress Has Options, but None Are Painless
The Social Security administration has given congress several ways to improve Social Security’s finances. Here are some potential strategies:
Increase Social Security Payroll Tax – Today, employees pay 6.2% of wages into Social Security, with employers contributing another 6.2%. If you’re self-employed, you’re generally responsible for both, 12.4%. Congress could increase those percentages which would help close the long-term funding gap, although it would mean higher taxes for workers and employers.
Increase the Social Security Wage Base – In 2026, Social Security taxes only apply to the first $184,500 of earned income. Anything above that amount is not subject to Social Security payroll taxes. Congress could raise the wage base limit, eliminating it all together, or begin taxing again above a higher income level. These approaches could generate additional revenue but at the cost of higher earners.
Adjust Future Benefits – Another option would be to change how Social Security is calculated. This can include changing the benefit formula, annual cost-of-living increases, or benefits paid out to higher-income retirees. These changes could improve Social Security’s finances, but future retirees would still receive less than they are currently expecting.
Increase Full Retirement Age (FRA) – For anyone born in 1960 or later, Full Retirement Age is currently 67. Congress could push that age higher. This might sound like a small change, but it would effectively reduce benefits for future recipients. Someone who wanted to retire at the same age would receive a smaller monthly check, or they'd need to wait longer to receive their full benefit.
We've seen this before. Social Security's Full Retirement Age was originally 65, and legislation passed in 1983 gradually increased it to 67.
Invest in Equities – The SSA has proposals that would simulate a portion of the reserves to be invested in equities instead of solely in government securities. Higher expected returns could improve solvency, but investment changes alone would not eliminate the funding shortfall
If I had to guess, the eventual solution will be some combination of changes rather than one simple fix. The longer Congress waits, the harder it becomes to phase those changes in gradually, which is a reason the discussion is becoming more urgent.
Should the Funding Problem Change When You Claim Social Security?
This is where the policy discussion becomes much more personal.
For many retirees, deciding when to claim Social Security is one of the most pivotal decisions they will make around retirement. It can affect not only their own monthly income for life, but also a spouse’s survivor benefit, their tax situation, and how much they need to withdraw from their portfolio.
As an advisor I sometimes hear investors say, “I should take Social Security as soon as possible because I want to get my money before it runs out.” I understand the instinct: if future benefits might be reduced, why not start collecting now?
Whether to claim at 62, Full Retirement Age, or 70 should consider many factors including life expectancy, marital status, survivor benefits, taxes, other retirement income, portfolio withdrawals, and the value of securing a larger guaranteed lifetime benefit.
Claiming early permanently reduces your monthly benefit. While delaying can meaningfully increase it. Someone who claims early because they are worried about a future cut may be giving up a larger lifetime income stream to protect against a change that Congress may ultimately address in a very different way.
Social Security’s finances should absolutely be part of the conversation. They just should not be the only part of it.
Build a Plan That Doesn’t Depend on Predicting Congress
I have my guesses about how Congress might address this, but that’s all they are.
For those planning for retirement, rather than trying to predict the outcome, a better approach is to stress-test the retirement plan under different Social Security assumptions. Model the impact of receiving 100% of your projected benefit, then look at what happens if only 80% of that benefit is available beginning around 2032.
The goal here is not to predict a 20% cut, but rather to understand how dependent the plan is on Social Security and where it may be vulnerable. Does the plan still work if benefits are reduced? Can the portfolio provide enough additional income? Would spending need to change? Are there other reliable income sources? Does the claiming strategy still make sense under each scenario?
We use this same approach with other uncertainties like markets, inflation, taxes and longevity. A resilient plan does not require every assumption to be right. What it needs is to be built with enough flexibility and margin to remain successful when things don’t go as expected.
And I think Social Security should be treated the same way. It's an important source of retirement income for millions of Americans, but we don't know exactly what Congress will do or when they'll do it.
What we can do is understand how dependent your retirement plan is on Social Security, consider what happens if benefits change, and make decisions today that give you flexibility down the road.

Disclosure:
This material is provided for informational and educational purposes only. It should not be construed as investment, legal, or tax advice, nor does it constitute a recommendation or solicitation to buy or sell any security. Investors should consult with a qualified financial professional before making any investment decisions. Rebalancing and asset allocation strategies do not ensure a profit or protect against loss in declining markets. There is no guarantee that any investment strategy will achieve its objectives. Any references to historical performance, academic studies, or research are based on past data and should not be considered indicative of future results. Past performance is not a guarantee of future outcomes. Advisory services offered through Human Investing, an SEC-registered investment adviser.
Sources
[1] Social Security Administration. (2026). The 2026 OASDI Trustees Report. https://www.ssa.gov/oact/tr/2026/
Social Security Administration, Office of the Chief Actuary. (n.d.). Old-Age, Survivors, and Disability Insurance Trust Funds, 1957–2025 [Data table]. https://www.ssa.gov/OACT/STATS/table4a3.html
Social Security Administration, Office of the Chief Actuary. (2025). Summary of provisions that would change the Social Security program. https://www.ssa.gov/OACT/solvency/provisions/summary.pdf
Social Security Administration. (2026). Contribution and benefit base. https://www.ssa.gov/oact/cola/cbb.html
Springstead, G. R. (2011). Distributional effects of accelerating and extending the increase in the full retirement age (Policy Brief No. 2011-01). Social Security Administration. https://www.ssa.gov/policy/docs/policybriefs/pb2011-01.html)