
Bonds are a fundamental piece of most investment portfolios, and the basics of bonds can confound even seasoned investors. When testing financial literacy through 5 core questions, bonds are frequently the topic that most commonly trips people up (try the quiz here). We want to make it easier for you to grasp the basics of bonds, whether you're new to investing or just want a quick review.
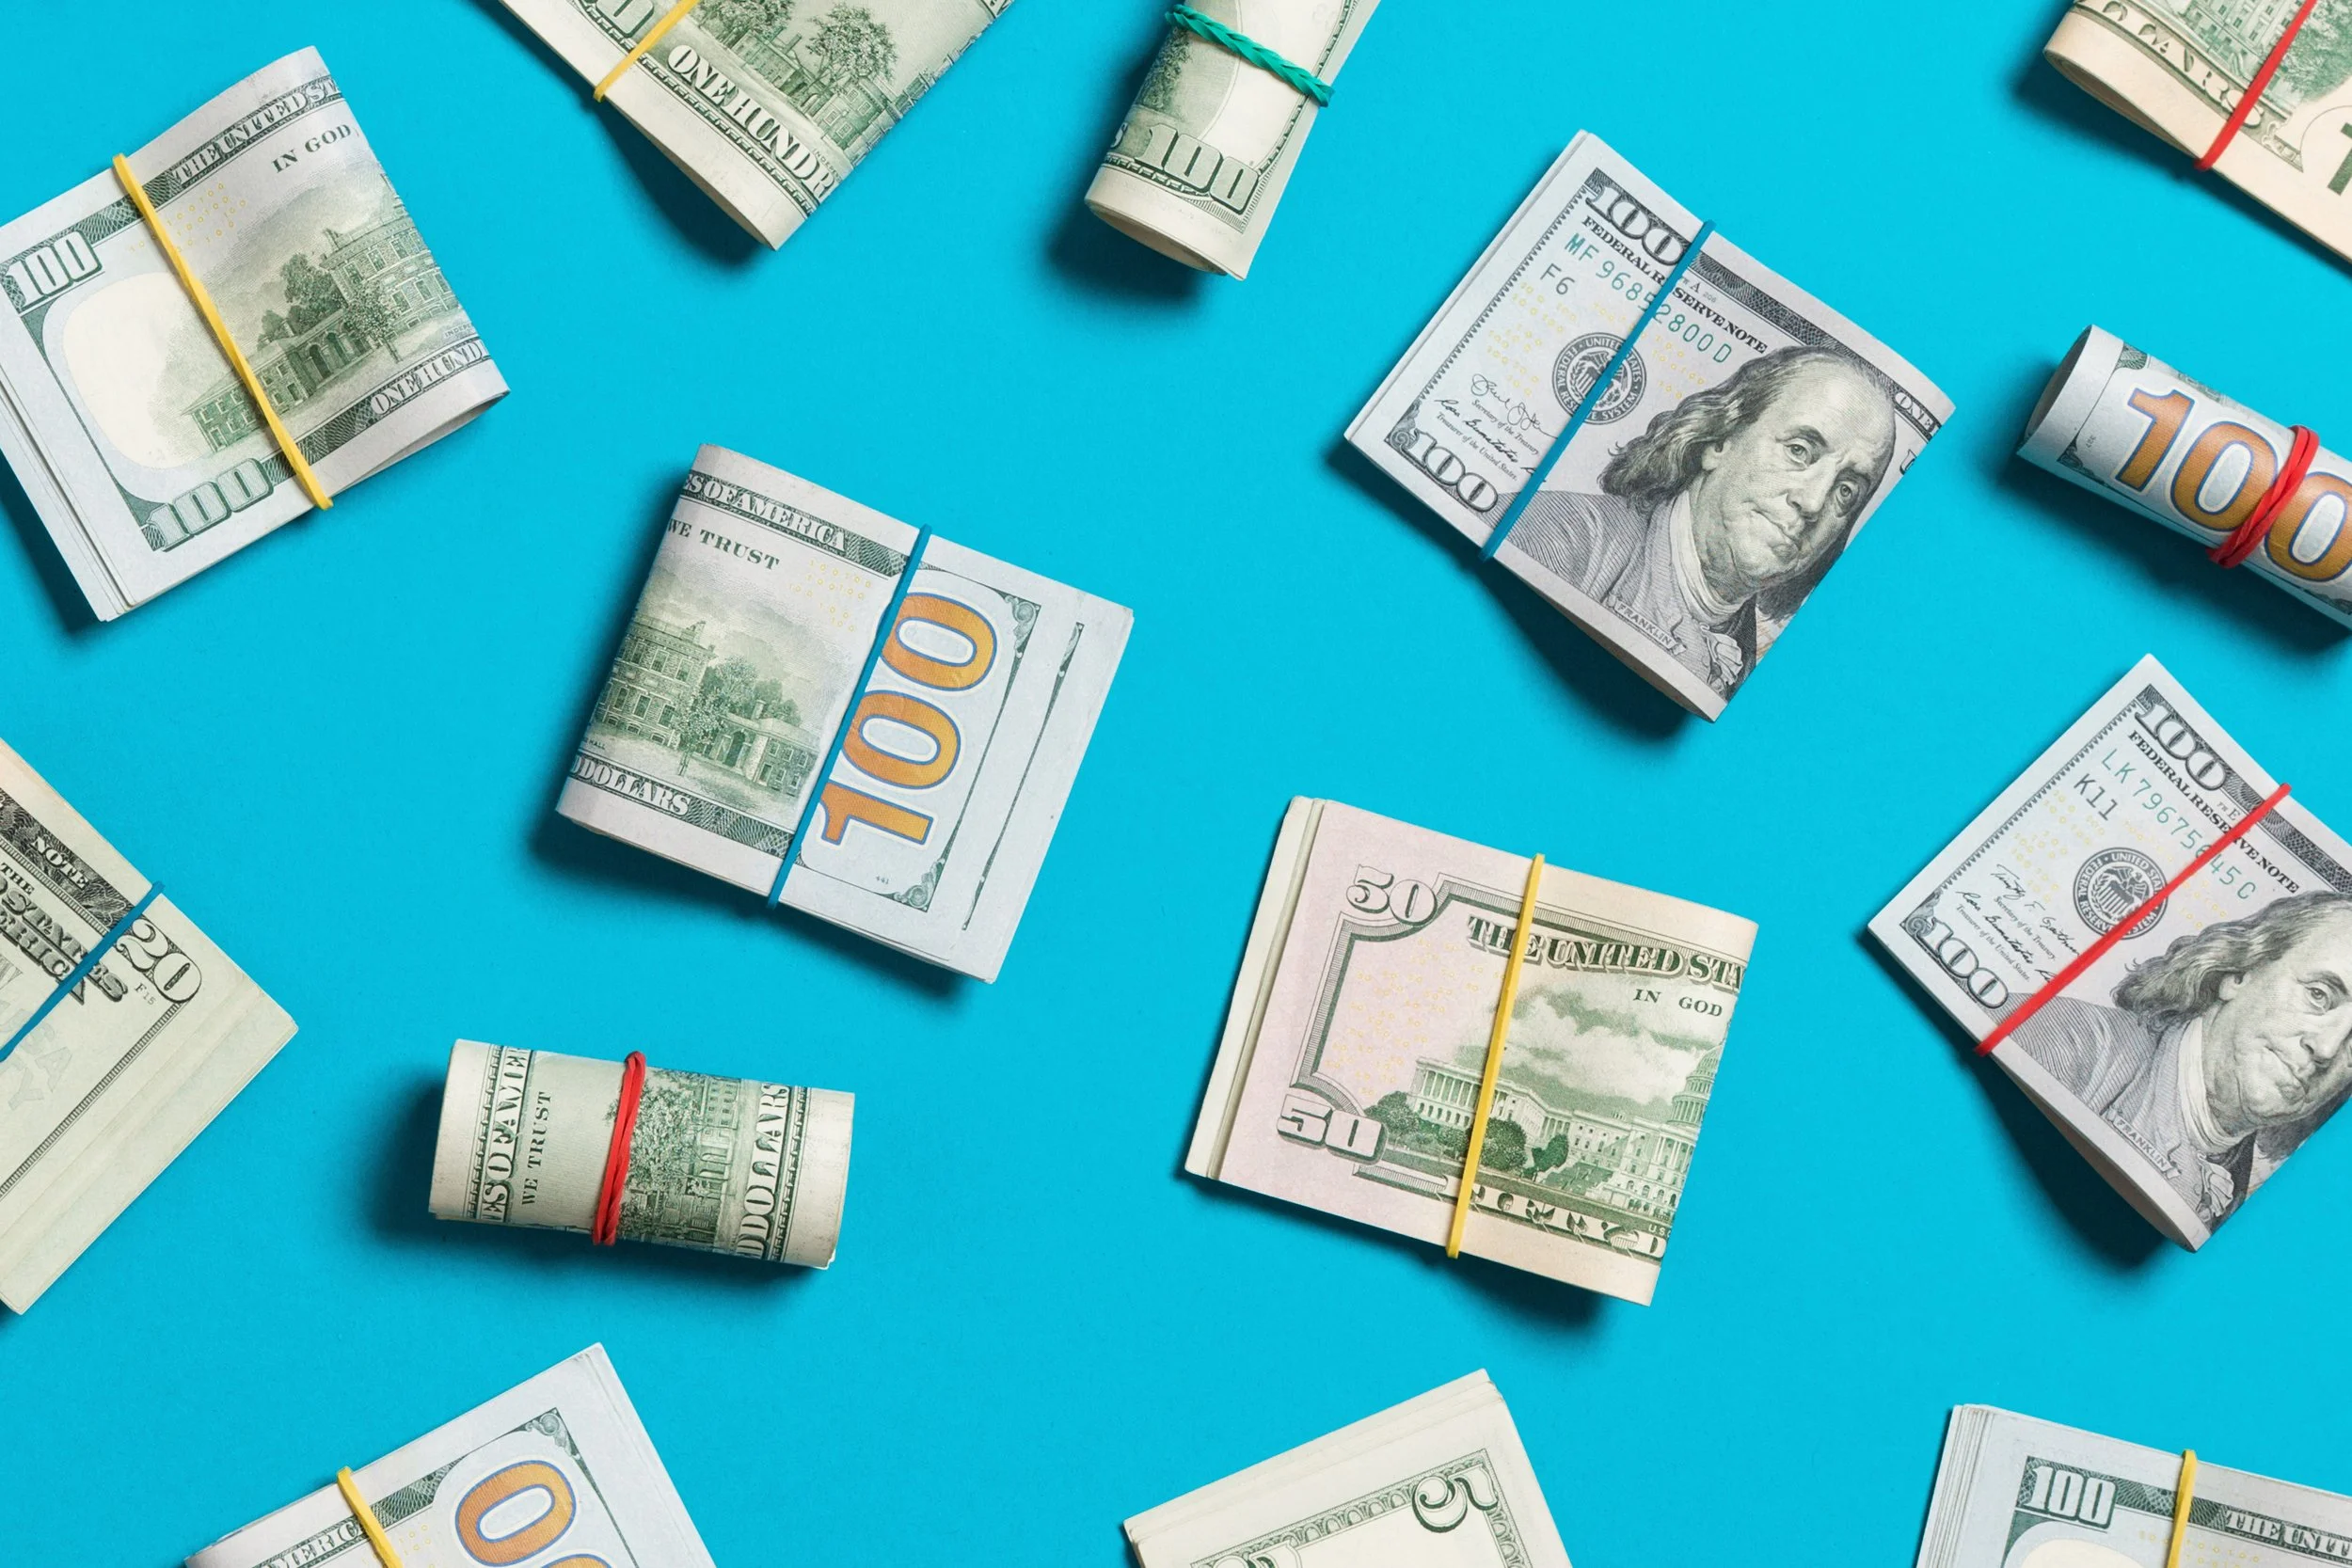
lend money to companies or the government
At its core, a bond is a type of loan. It's usually issued by governments or companies that need to borrow money. When you buy a bond, you're essentially lending money to the issuer. As the bondholder, you receive interest payments from the borrower.
Bonds are generally considered less risky than stocks, because if the borrower faces bankruptcy bondholders get paid before stockholders. However, the return on bonds is typically lower than stocks, and there's a risk that the borrower might not be able to pay back the debt.
key terms related to getting paid back
The principal value is the amount being borrowed by the issuer. Typically bonds trade in $1,000 increments.
The maturity date is the date the bond will return the principal value (aka face value) to bondholders.
You also receive interest when you lend money. The interest received is usually based on the Coupon rate, which is the interest payments paid to bondholders. Typically as a percentage of face value paid annually. For example, if you have $1,000 of a bond with a coupon rate of 5%, you will receive $50 in interest payments every year until the bond matures. Upon maturity, you will get the $1,000 principal back.
Credit rating is like a credit score for a government or company, indicating how likely they are to make payments. A higher credit rating indicates a higher chance of the issuer making payments.
Imagine if Disney needed to raise money via bonds
When a bond is first issued, the issuer sets the terms like the coupon rate and maturity date. The reality is that interest rates and credit risk (how likely the issuer is to payoff the bond) change after the bond is issued, which causes the bond price to fluctuate.
Imagine if Disney issues bonds paying 5% interest, the current market rate.
You purchase a bond for $1,000, and you get a $50 coupon payment from Mickey Mouse every year until the bond matures.
If interest rates go up, this isn’t good for your bondS
If interest rates rise next year to say 8%, and Disney issues new bonds, they will probably issue them at the new interest rate.
Your neighbor Laura decides to buy $1,000 of the new bonds, and she gets an $80 coupon from Mickey Mouse every year.
Because interest rates rose, the value of your bond paying $50/year goes down in value, less than the $1,000 you purchased it for because the $1,000 could buy Laura’s bond paying $80/month.
The reverse if also true. If rates had fallen to 3%, Laura’s bond would only pay her $30, and your $50/month bond would be worth more than $1,000. This is why when interest rates rise, bond prices fall.
Think of a teeter-totter: When one side’s down (interest rates), the other side must go up (bond prices).
When your bond is trading below $1,000, it is trading at a discount, typically with a coupon rate lower than current interest rates. If your bond is trading above $1,000 it is trading at a premium, typically with a coupon rate higher than current interest rates.

Timing bond returns
Remember that the bond market is full of smart people looking to try and make money. As a result, all similar bonds are priced so they provide similar returns. For example, if you see a 2 year bond with a 5% coupon, and a 2 year bond with a 3% coupon, the price of the 3% coupon bond will be so much lower than the 5% coupon bond and you will end up making just as much money either way. This is called the yield, or coupon + price return on a bond. Keep in mind if there are differences in bonds (i.e. higher or lower credit risk, time to maturity, other terms of the loan), that can cause differences in yield too.
When should I own bonds?
Long term equities tend to produce higher returns than bonds. However, these equity returns involve higher risk, and some people can’t afford to wait to make their money back. Bonds are an important ballast to ensure you can sleep at night, keeping a portion of your portfolio safe. Bonds can also provide a reliable source of cash flow that can be more reliable than stock dividends.
Finding the right bond for you
Like stocks, there are different bonds. Sovereign bonds (issued by governments) tend to be less risky, providing lower returns because of the lower credit risk. On the other hand, corporate bonds (issued by companies) provide higher returns, with an increased danger of losses due to companies going bankrupt.
At Human Investing, we provide individual treasury ladders for clients. US Treasuries are broadly considered one of the safest investments in the world. By owning individual bonds, you know you will get your principal returned upon maturity. The liquidity of treasuries also allows for flexibility if funds are needed sooner than anticipated.
Alternatively bond funds can be an excellent solution for clients, particularly those seeking growth. By investing in a bond fund, you gain exposure to a diversified range of bonds, enabling you to take on credit risk more effectively than as an individual investor. Much like owning a stock index fund, owning so many different companies debt means even if a few go bankrupt, they are such a small piece of your portfolio you will be okay.
Still have questions, or want to talk to an advisor? Reach out to us at hi@humaninvesting.com, or 503-905-3100.