Posts in Economic Commentary
Charts of Q2 2022
 

April, May, and June 2022 have been long, emotional months. The purpose of our charts of the quarter posts is to provide financial updates, and it may be no surprise that this post is focused on interest rates, housing prices, and market volatility.

1: Interest rates increased by HALF A PERCENT in May 2022

On May 4, 2022, the Federal Reserve raised interest rates by ½ a percent. While ½ of a percent may feel insignificant, this was the most significant interest hike in more than two decades.

What does an increased interest rate mean for you? It means that borrowing money from the bank is more expensive. It has also historically been good news for your saving and investment accounts.

Specifically, this chart summarizes investment returns since 1990 after the Federal Reserve raised interest rates by at least ½ a percent. As you can see, on average, stocks returned +20.5%, and bonds returned +13.8% one year after the interest rate hike. Only time will tell what happens, but it wouldn’t surprise us if returns got better in the coming months.

Source: Morningstar

2: How long does it take to get your money back?

During Q2 2022 – from April 1 – June 30, the S&P 500 returned -16%. Checking your account balance hasn’t been a pleasant experience in Q2 ’22.

Most people want to know the answer to the question, “how long is it going to take to get my money back?” Since this was a recurring question this quarter, Andrew Gladhill wrote a blog post called Payback Periods: How Long to Make Your Money Back. We encourage you to read the full article, but we selected one chart to share from this post.

This chart states that 95% of the time, it takes nine months for investors to, once again, reach another all-time high in their account. Said differently, most of the time, the market rewards investors who stay invested for at least nine months. What does this mean for you?

Remaining invested and, in the case of 401(k) accounts, continuing to invest your dollars is the easiest way to see your account balance recover. This can be an uncomfortable experience, and we recommend reaching out to our team if you feel uneasy or want to brainstorm ways to adjust your account strategies.

Source: CFA Institute

3: Are we heading into a recession?

Source: Google

Are we heading into a recession? Are you feeling worried, fearful, and frustrated? As this chart illustrates, the Google Trend for the search engine “recession” since the beginning of 2022 has quadrupled.

Everyone is looking for an answer that doesn’t exist. We cannot predict if there will be a recession or how long it will last. We know that recessions are a regular, unavoidable part of economic cycles.

Here are a few questions to ask yourself in preparation for a recession:

Do I have job security?
Does my spouse have job security?
What fixed expenses do I have? (Examples may include mortgage payments, car payments, daycare payments, and recurring health care payments)
Do I have emergency savings to pay for my fixed expenses?
Would a recession change my current investment strategy?
Does anyone really know if there is a recession coming?

We also know that compared to the recent past, US Households currently have more cash and cash equivalents in their bank accounts. This chart, dating back to 2015, shows the rise of cash on hand for US Households. We may be more prepared for a recessionary period than we think we are. As the previous recession preparation questions suggest, it is essential to have liquidity during a recessionary period to help pay for fixed costs, protect against a loss of income, and to avoid selling investments while the markets are volatile.

If you need help answering any of the questions above, please contact your team of advisors at Human Investing.

4: Mortgage rates doubled in Q2 2022

Mortgage rates, as you may have seen, surged in Q2’22. Average mortgage rates went from 3% to 6%, which is the most significant one-week increase in interest rates since 1987. At about 6%, 30-year mortgage rates are back to where they were in November 2008. 

We wanted to share this chart which illustrates the increase in mortgage payments since 2015. As you can see, monthly mortgage payments have increased over time, but 2022 has experienced a remarkable surge in average monthly mortgage payments.

Let’s see how the rest of summer unfolds. Suppose you are in the market to buy a home. In that case, we highly recommend understanding all the costs associated with purchasing a home, including closing costs, property taxes, monthly payments, and repairs.

Source: Redfin


For a more in-depth overview, read this Redfin article.

Our team is always here for you should you have any questions or concerns about your financial landscape.




Related Articles

Is Inflation Affecting your Investments?
 

Inflation can lay waste to portfolios and wages, which is one of many reasons why inflation is concerning for laborers and investors alike. Some speculate that the rise in inflation is from supply chain congestion, resulting from labor shortage due to the Coronavirus pandemic. Others hypothesize that a flood of liquidity into the global economy, which stems from quantitative easing dating back to the financial crisis in 2007-2009, is the cause of rising prices. Regardless of the reason, the concern is that gains in wages and market appreciation are muted, or worse, erased, by an escalation in prices for goods and services.

Inflation’s History

It has been three decades since we've seen inflation at current levels and even longer since inflation averaged double digits (several different times in the mid-70s to early 80s)[1]. Clients of our firm who remember the 1970s recall long gas lines, borrowing for a home purchase at 15%, and investing in treasury bonds at over 10%.

Consider this: in October of 1981, the 30-year mortgage rate was 18.45%[2]. As I type, that sort of rate seems almost unthinkable, yet it's true. To illustrate how it would impact the average homeowner or investor today, imagine a $500,000 home purchase with a 20% down payment. An individual would be financing $400,000 and be left with a $6,175 payment!


How Does Inflation Work?

Inflation works in a similar way with food, gas, and other products and services we use regularly. Inflation can be viewed as a tax that leaves consumers with less to spend at the end of each month. With consumers facing higher prices, the dollars they spend must go to the staples such as food, housing, and gas—while potentially having less to spend on discretionary items such as travel and entertainment.

To combat inflation, the Federal Reserve (the Fed) will typically increase short-term borrowing costs on member banks—which in turn, trickles down to the consumer. Managing inflation is a primary objective of the Federal Reserve. The inflation target for the Federal Reserve is 2%. With both headline and core inflation trending well above those targets, aggressive rate increases are warranted. Surely the invasion of the Ukraine by Russia has complicated the Fed’s rate decision. My previous article “War and the Market: What Does History Teach Us?” discusses this topic further. Despite the concern over the war in Ukraine, the question is not if the Fed will raise rates. Instead, it’s a matter of how fast the Fed will hike rates and when they will stop.


Our Recommendations

First, revisit your budget. See where you are seeing the biggest increases as some individuals are impacted far more than others. For example, my brother is a sports fisherman who is impacted much more by the price of fuel than I am with a five-mile commute to work. At the same time, a family of seven will feel food inflation much more than my parents, who have been empty nesters for almost 30 years. Secondly, once you have revised your budget, a conversation with your advisor can be warranted. For some who are living off a fixed income, the process will require pairing back or needing larger distributions from your portfolio. For others, it may prompt a change in your investment mix. While for many clients, the process may entail staying the course.

Investors whose investment horizon is long-term should continue to invest in a diversified, low-cost, equity-leaning portfolio. However, for investors who are either uneasy with market gyrations or have a more condensed investment timeline, multiple levers can be pulled to potentially position the portfolio to hold up well during inflationary times. Many experts agree that treasury bills and private real estate hold up well during inflation. [3],[4] It is also important to note that during inflation cycles, equities do well; however, volatility can increase, making maintaining a portfolio heavy on stocks problematic for investors whose emotions can get the best of them.


Guidance for Those who are Worried

If you are prone to worry about your investments, there are several actions to consider. First, consider looking at your investments less often. This does not mean a “head in the sand” approach. Instead, if you are looking at your portfolio a few times per day, consider a few times per week. Or, if it’s weekly, consider checking in on your accounts monthly. Second, look at history for context surrounding the volatility. What you will find is that the market, on average, experiences a 14% intra-year drops since 1980. This may not provide you all the peace you want , but having perspective on what is normal can be helpful in curbing emotions. To further combat mixing emotions with investments, read “How to Avoid the Investing Cycle of Emotions” by our own Will Kellar, CFP®. Finally, if the volatility is cause for sleepless nights, you may be someone that needs to take less risk, meaning a conversation with your advisor is warranted.

Because the course of this inflationary cycle is unknown, it is essential for all investors to track their spending to determine what impact inflation has had on budgets. For some, there is plenty of discretionary capital to absorb the increase prices; however, for others, it may be necessary to tighten the belt and prioritize essential spending, to minimize the impact of elevated costs.

[1] U.S. Inflation Calculator

[2] History of Mortgage Interest Rates

[3] Fama, E. F., & Schwert, G. W. (1977). Asset returns and inflation. Journal of financial economics, 5(2), 115-146.

[4] Crawford, G., Liew, J. K. S., & Marks, A. (2013). Investing Under Inflation Risk. The Journal of Portfolio Management, 39(3), 123-135.


If you have feedback for us, have questions, or would like to hear more on other topics we’ve not already covered, please email us directly at hi@humaninvesting.com. We cherish the emails and questions and look forward to connecting with you soon.


Related Articles

Payback Periods: How long to Make your Money Back?
 

As I write this in May 2022, most major asset classes are down for the year. Stocks, bonds, foreign or domestic, it’s hard to find an investment producing positive returns right now. Since no investor likes to see the balance in their account drop, we have received an uptick in client inquiries about whether it’s worth staying invested. The short answer is yes; we still recommend staying invested. Markets have historically recovered, and grown to new highs. Panicking and selling your investments when they’ve gone down in price is unhelpful for achieving your long-term investment goals. Staying invested when the markets are roiling is easy to say, hard to do.

If you’re interested in a longer, more data driven response about why you should stay invested, keep reading. A lot of client’s concerns boil down to “How long is it going to take for me to make my money back?”. Let’s call this amount of time it takes to hit a new all-time high for a portfolio the “payback period”.

For the returns, I pulled the Ibbotson SBBI US Large-Cap Stocks for equity, and the Ibbotson SBBI US Intermediate-term (5-year) Government Bonds for fixed income. This data compiles the monthly returns from January 1926 to March 2022. I took a 100% equity portfolio (100/0) and added 10% bonds to compare different allocations (i.e. 60/40 is 60% equity 40% fixed income). I assumed monthly rebalancing.

Source: CFA Institute

As the graph shows, the more conservative your allocation, the shorter the time-frame necessary to make your money back. The most aggressive allocations (100/0 and 90/10) can take about 15 years to make your money back. A more balanced investor (40/60 to 80/20) would expect around 7 years as the worst case to make their money back.

I want to emphasize these numbers reflect the absolute worst scenarios over nearly a century of investing. We could always see a new worst case. Typical experiences are usually not as extreme. Even just looking at the 2nd longest time-frame to make your money back, and the longest payback is just over 6 years.


Source: CFA Institute

In most cases, you will make money in a relatively short amount of time if you remain invested. The final graph shows how long your investment horizon needs to be to have made money 95% of the time. As you can see, a majority of the time markets reward investors who stay invested for at least 9 months. That 5% of times where you haven’t made money in 9 months, we have seen some major draw-downs that took years to recover from. Make sure you have positioned yourself in a way where you are comfortable with all possible outcomes.

Source: CFA Institute

So, what do we do with this information? Some perspective for us all:

Understand the Time-frame you’re Investing For

If you’re not accessing funds for 15+ years, you shouldn’t worry about how long it takes to make the money back.

  • If you are investing in a retirement account, keep doing that.

  • If you move money monthly into a brokerage account, keep doing that.

If you are planning on accessing the funds in 10 years or less, consider incorporating bonds in your allocation to reduce risk, and shorten the time frame to recover a loss in value for your portfolio.

If you’re currently accessing your funds, have a financial plan to understand how you handle downturns in the markets and still achieve your financial goals

  • Strategies for this include having a certain amount of cash on hand to cover market downturns, adjusting your budget as needed, etc.

Stay Invested

When you see your account balance down, know that remaining invested is the best way to recover lost value. Most of the time, you won’t have to wait for years to see your balance recover.

Plan in a way that Helps you Sleep at Night

If you can’t handle the thought of waiting seven years to make your money back, a 70/30 allocation may not be right for you. Have a financial plan in place that accounts for the worst-case scenarios, so you know you’ll be able to ride out any volatility in the markets.

Understand History can Only Tell us so Much

The markets could always find a new worst-case scenario. Use history as a guide for setting expectations, not absolute certainty of what is to come.


Related Articles

Do's and Dont's of a Bear Market
 

It can be agonizing to watch your portfolio decline during a down market. Our human nature is to react erratically, which can be destructive to your financial plan. While it is important to stay the course, that doesn't mean you need to be idle. There is always an opportunity to do something to better your financial house. Here are a few productive things you can do as an investor during a down market: 

Do: 

Take Advantage of Opportunity

Invest cash: Risk assets like stocks are discounted, and as such, now may be a timely opportunity to invest the cash you have on the sidelines. Yes, markets may go down further, so be prepared for additional short-term losses. When investing additional dollars, don't let a desire to time the market-bottom perfectly get in the way of taking advantage of the opportunity.

Look for opportunities to Tax-loss harvest: Tax-loss harvesting allows you to get a tax break for poor-performing investments in a brokerage account. This strategy allows a taxpayer to offset other taxable gains and potentially claim a deduction against ordinary income. This is an unseen benefit for investors who have a brokerage account and want to use poor-performing investments to lessen their tax burden. (See Tax Tips in a Down Market

Keep an Eye on your Financial Goals

Rebalance: Market moves can result in a drift of your account's investments. Rebalancing your investments to your desired investment strategy can restore the appropriate level of risk and return to your account. Making sure you have an appropriate amount in stocks will help you take advantage of the possible market rebound. 

Accelerate Savings: Are you systematically saving into an investment account, such as a 401(k), IRA, or brokerage account? Consider making a larger contribution now to take advantage of the opportunity. This is a similar thought process to investing cash. 

Roth IRA conversions: Stock market downturns make for an opportunity to convert traditional IRA dollars to a Roth. When you convert dollars to a Roth IRA, you are responsible to pay income tax on the conversion amount. You are trading the tax-deferred (pay taxes when you withdraw) growth for tax-free growth. Before you complete a Roth conversion make sure you understand the tax implications and talk to your advisor or tax professional. 

An example: Your IRA was valued at $10,000 and is now valued at $8,000 due to market loss. To convert your IRA to a Roth, you would pay income tax on $8,000 rather than the previous amount of $10,000. Any growth from the time of the conversion is now tax-free for qualified withdrawals.  

Stay Educated

Read a book - My favorite personal finance book is the Psychology of Money by Morgan Housel. Housel provides timeless lessons about personal finance, human behavior, and long-term investing. Give it a read and let us know what you think. 

Don’t:

Don't invest short-term cash: Strategic cash cushions do have a significant place in a financial plan. Now is a prudent time to assess your cash holdings. Never use short-term dollars to invest. 

Don't watch your account or market too closely. Staring at a screen during periods of market fluctuations can be poisonous to your emotional wellbeing. Log out, take a deep breath, and go for a walk.

Don’t panic sell - The key thing for many investors is not to panic, stick to your plan. Remember that market declines are normal. This is the price of admission for long-term returns. 

 What We’re Doing for our Clients

Our team at Human Investing continues to carry our methodical approach to help steward our clients’ dollars. Our investment analyst team is constantly looking for opportunities to tax-loss harvest and rebalance. All the while, our Investment Committee persists in our due diligence for opportunities to enhance our investment strategies. 

While it is important to stay the course, that does not mean you need to sit on your hands and do nothing. We hope to provide you with a list of constructive things you can do to better your financial plan. Please let our team of credentialed advisors know if there is anything we can do to help you navigate the current market.  


Related Articles

War and the Market: What Does History Teach Us?
 

With Russia’s invasion of Ukraine this week, many are wondering how a conflict in Europe will influence their own finances. In addressing this headline for our firm, please understand that the loss of life and the disruption of peace weighs heavy on me and our team. While considering investor concerns, our goal is to provide a point of view which I feel we are uniquely positioned to share amid war as a financial management firm.

Markets trade on future expectations. For example, if the market expects new jobs or a strong economy, then people and businesses adjust their decisions today, based on what they believe is coming. Remember how the market crashed when COVID-19 first hit the United States, but bounced back a month later? That’s because people were making choices based on expectations, not necessarily reality.[1] Because war follows a circuitous route, forecasts are less clear. Researchers accurately note that “the impact of conflict on human lives, economic development, and the environment is devastating.”[2]

Previous Wars and Invasions Show That Market Reactions can Range Wildly.

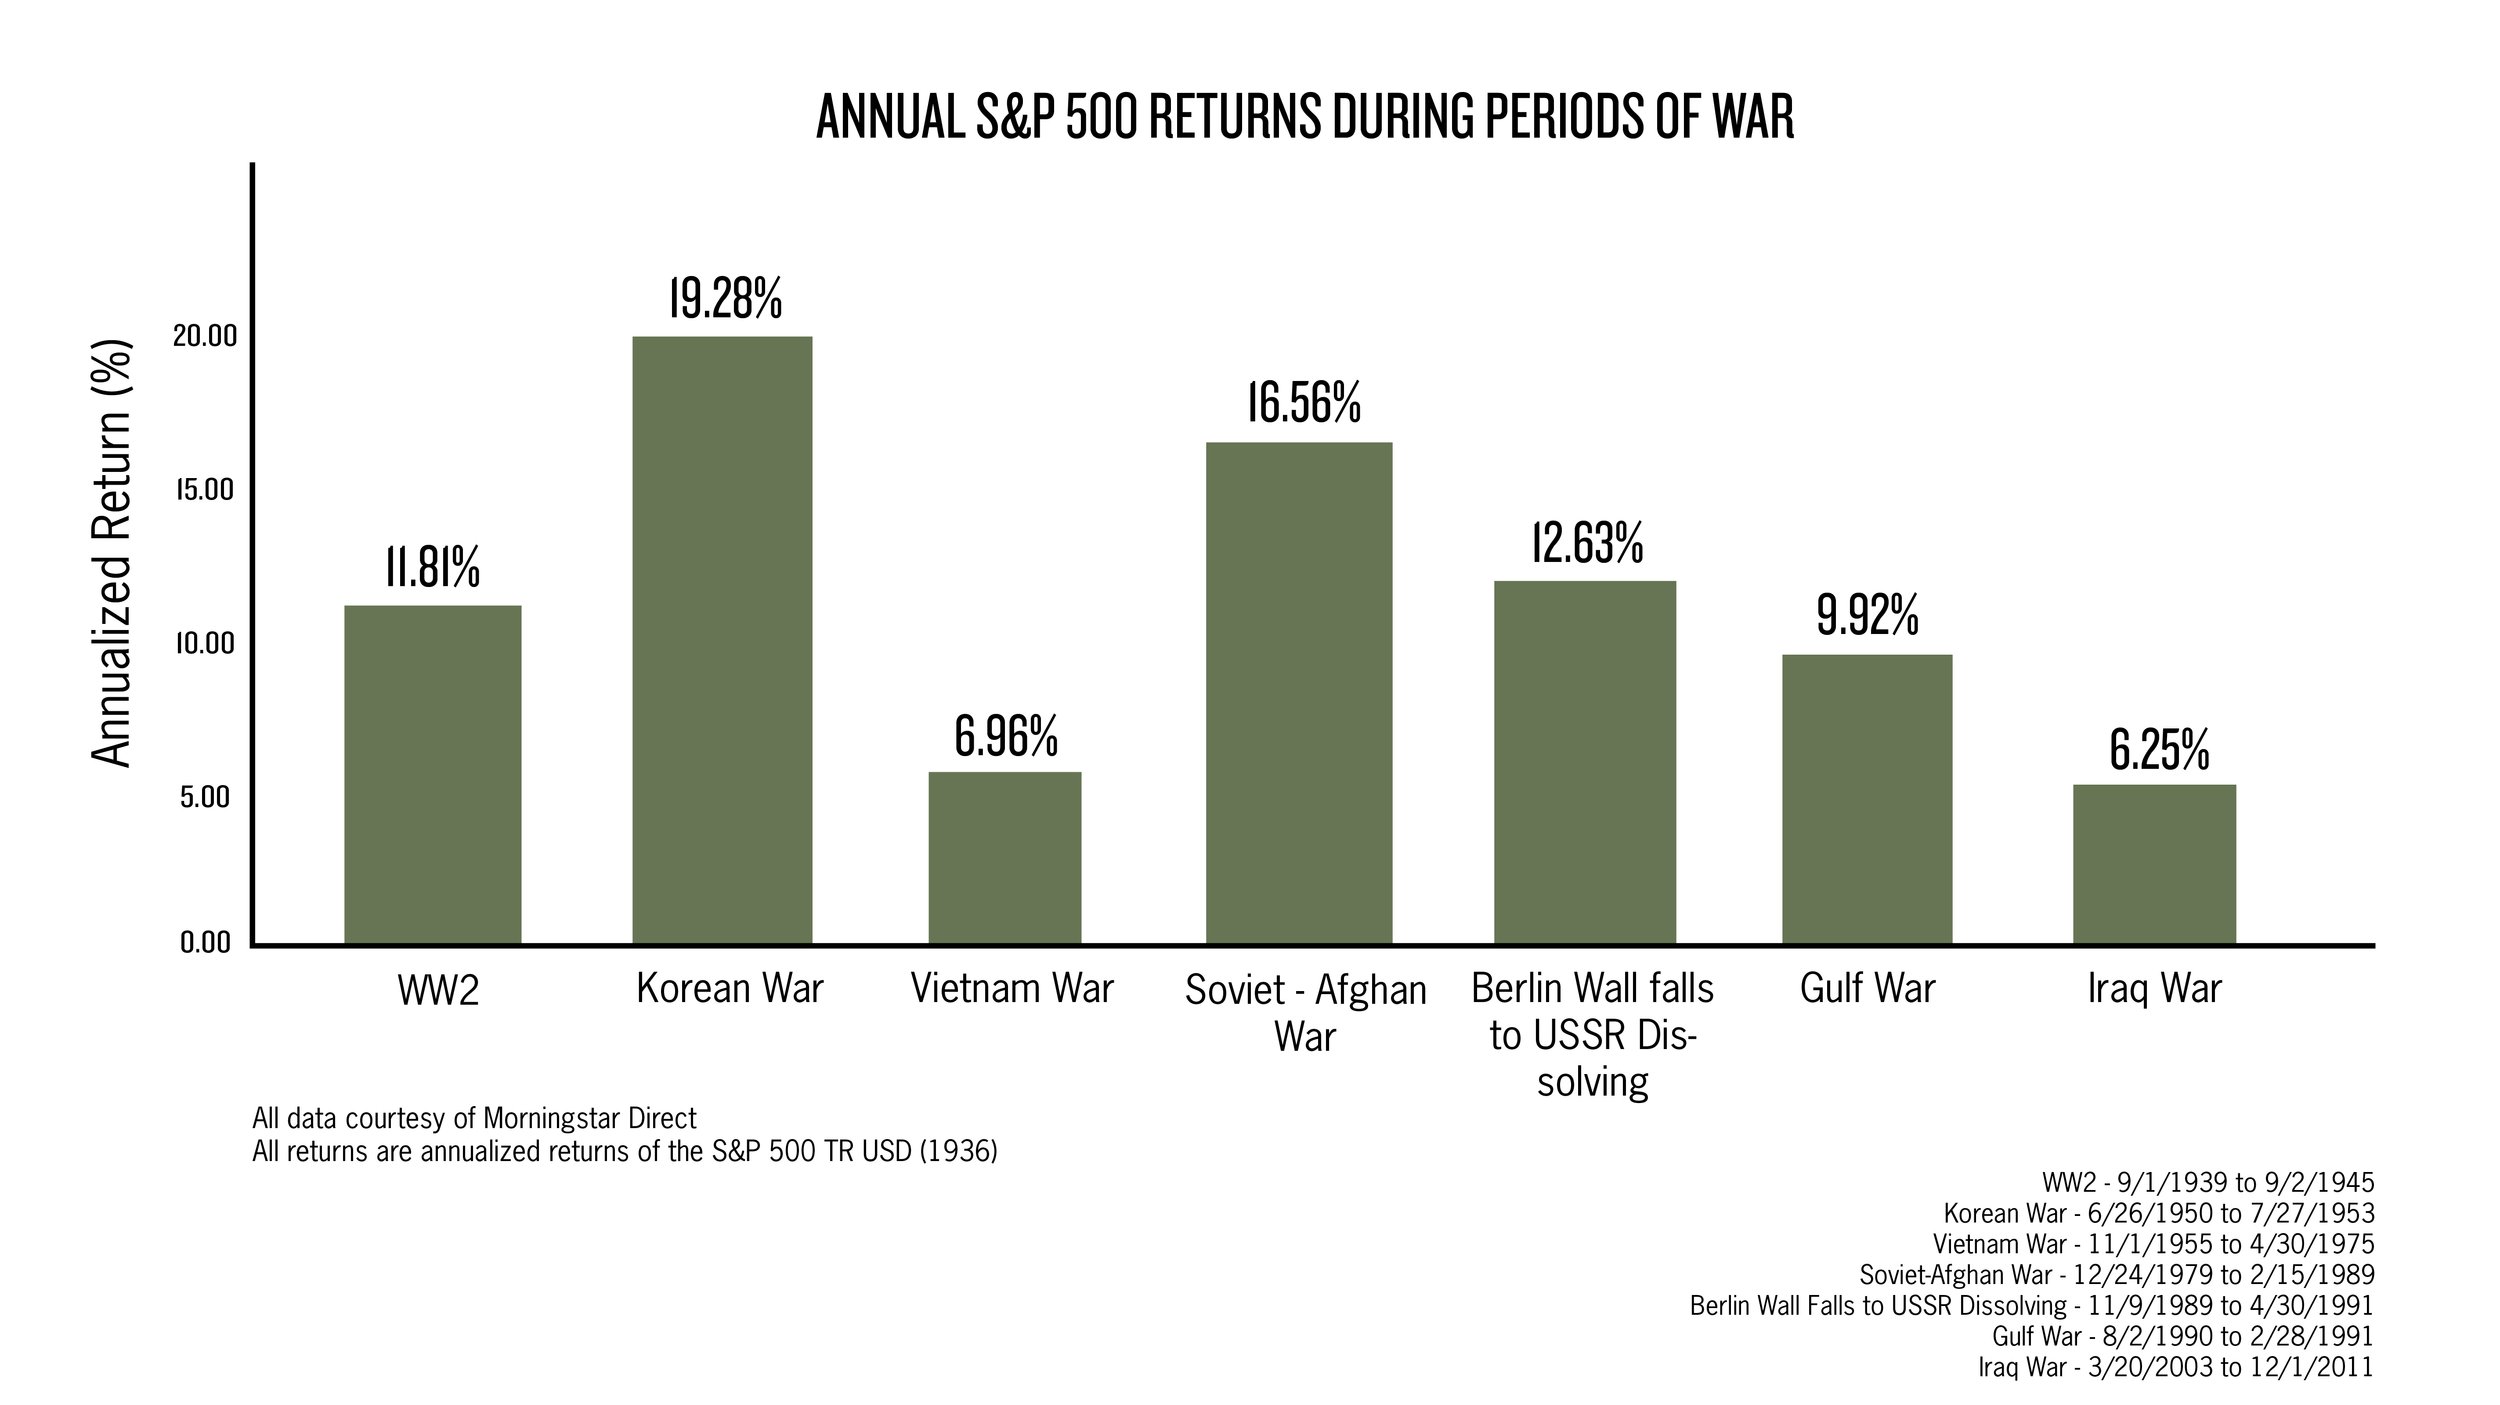
For example, in 1990, Iraq invaded Kuwait and immediately the global stock markets declined.[3] In the three days that followed the Iraqi attack on Kuwait, the Dow Jones Index slid over 6%; yet in the first four weeks of Operation Desert Storm, the Dow gained 17%.[4] Additionally, the European Stock market responded positively to the second conflict with Iraq in early 2000. Stock market history has shown divergent reactions to war.


Surely, the economy of Ukraine will be devastated, but no one knows what the financial repercussions from this Eastern Europe conflict are. For example, when the news broke about Russia’s invasion, the European markets went down around 4%, but the US market went up by about 1.5% at the end of the day. We simply can’t predict the future, and the market changes moment-to-moment, day-to-day. The only real certainty is that volatility will resume as individuals and institutions place their bets on future predictions, and because of this, our client financial plans and asset mixes navigate all types of situations.

Finding your Footing in Uncertainty

Market related volatility is an un-welcomed but natural part of the investing journey, so our client portfolios at Human Investing are constructed with a plan and risk tolerance in mind. For example, a client that has cash needs to support their day-to-day expenses (such as a retiree) will often have a portfolio with equities that pay dividends, bonds that pay interest, and ample cash to cover upcoming obligations. On the other hand, investors who rely on equities should understand that stock volatility is the price we pay for the expected premium we receive in the long run over cash and bonds.

Although the headlines of “war” and “invasion” cause anxiety, the questions investors should ask are, “How is my plan working out?” and “Despite the market volatility, am I still on track?” Keep in mind that although the average annualized return of the S&P 500 since 1926 is approximately 10.5%, market swings may increase considerably. [5]  Investors should think about their financial plan, investment goals, timelines, and overall diversification to determine how well they are prepared to manage the ups and downs. Adjustments can always be made to ease the concern in the short term, but for most of our clients, their financial plan and current asset allocation take into account market downturns, caused by a myriad of events, including invasions and war.  Through it all, we at Human Investing are present in all of life’s ups and downs as we faithfully serve the financial pursuits of all people.


[1] Frazier, L. (2021, February 11). The coronavirus crash of 2020, and the investing lesson it taught us, Forbes. The Coronavirus Crash Of 2020, And The Investing Lesson It Taught Us

[2] Cranna, M. (1994). The true cost of conflict. New York: New Press. The true cost of conflict / | Colorado Christian University

[3] Richter, P. (1990, August 3). Markets react to Kuwait crisis: Stocks: Invasion rocks market; dow slides 34.66, Los Angeles Times. MARKETS REACT TO KUWAIT CRISIS : Stocks : Invasion Rocks Market; Dow Slides

[4] Schneider, G., & Troeger, V. E. (2006). War and the world economy: Stock market reactions to international conflicts. Journal of conflict resolution50(5), 623-645. War and the World Economy: Stock Market Reactions to International Conflicts

[5] Maverick, J. B. (2022, January 13). What is the average annual return for the S&P 500? Investopedia. S&P 500 Average Return: Overview, History, and Factors


Related Articles

Charts of Q4 2021
 

Season’s Greetings! We have assembled this post during the final days of 2021. We hope you have enjoyed some rest these past few days and you are heading into 2022 feeling optimistic.

As promised, we are sharing some of our favorite charts from Q4. Specifically, we included charts that include information about the increase in Social Security benefits, the S&P500’s 69 all-time highs in 2021, mentioning the S&P500 powerhouses, and reviewing some annual price changes.

1: Social Security and Supplemental Security Income (SSI) benefits will increase 5.9% in 2022.

In October, it was announced that Social Security benefits will increase by 5.9% starting in January 2022. As this chart indicates, the 5.9% increase starting in 2022 is the largest uptick since the 1980’s. This is good news for most people since social security checks will be bigger.

The increase in benefits impacts households who are already taking social security and those who will be taking their benefits soon. If you haven’t already received the COLA notice in the mail, you can access your updated Social Security statements here: my Social Security | SSA

2: The S&P500 reached 69 all-time highs in 2021.

Throughout this past year, the S&P500 hit a new all-time high 69 times. That’s remarkable! You should spend some time looking at this chart, but as a sneak peek, 1995 is the only year that incurred more all-time highs that 2021.

What does this mean for you? Looking back, it means that checking your account balances in 2021 was thrilling if you have exposure to the S&P500. To summarize the year’s performance, the index is up almost 30% since January 1, 2021.

During market years with this many records, the stock market attracts fair-weather fans. Going forward, we recommend that you define and/or revisit your investment goals and stick to your plan as best as possible.

3: The S&P500 powerhouses.

The S&P500 is a stock market index that measures the performance of about 500 companies in the US. If you have attended one of our group presentations, then you may recognize that we often say that “the S&P500 is synonymous with the US stock market”.

By the end of 2021, there were 6 companies that made up 26% of the market capitalization (# of shares x price of the shares) of the S&P500. These same 6 companies only made up 10% of the S&P500’s total revenue, or the money the companies pulls in from their sales.

This chart made an appearance in our final Charts of the Quarter post for 2021 as a reminder that these six organizations (Microsoft, Apple, Google, Amazon, Tesla, and Meta Platforms) have kept their spots in the starting line-up of the US stock market. We can also give kudos to these six companies for the S&P500’s returns in the recent past. Since 26% of the S&P500 has strong performance, the 2021 bad apples received less attention.

4: Picking trends is (still) hard.

We assembled a chart with two companies that we rely on everyday — Peloton and Zoom. Zoom has been crucial for engaging with our clients these past two years and many Human Investing employees converted to Peloton workouts mid-pandemic. Look at this chart! There is a disconnect between Zoom and Peloton’s abysmal performance in 2021 and our expectations as loyal customers.

Let this chart be a reminder that picking trends in the stock market has always been challenging and it will continue to be going forward. Investing in individual companies can lead to a make-or-break situation.

Source: @Sean_YCharts

5: Inflation took over headlines in Q4 2021.

Overall, the CPI (Consumer Price Index) rose 6.2% from October 2020 to October 2021. This is the fastest annual increase since 1990. While it is true that things got more expensive this past year, inflation is a delicate topic because every year some things get more expensive while other things become more affordable. For this reason, we try to avoid generalizations about inflation.

As the chart indicates, this past year we have experienced a concentrated increase in transportation costs like fuel oil, motor fuel, car and truck rentals, piped utility gas service, and used cars and trucks. Meanwhile, the average cost of an airline ticket has decreased compared to 2020.

We agree that inflation is uncomfortable. That is a true statement even though inflation is always moving and rarely a stable metric.


That is a wrap for the 2021 year. We wish you the very best 2022! — Your Human Investing Team


Related Articles

Charts of Q3 2021
 

Welcome to fall! Before we race to the pumpkin patch, let’s look back on July, August and September. We selected 5 different visuals from the past quarter to share with you.

1: The S&P 500 Reaches an All-time High

On September 2, 2021, the S&P 500 closed at an all-time high (see chart). While this is a record-breaking statistic, the S&P 500 has also experienced more than 50 all-time highs in 2021. Prior to this year, there are only six other calendar years with at least 50 record closes (2017, 2014, and 1995 are the most recent years).

As a result of these market highs, we have noticed heightened concerns about a looming market crash. Because what goes up, must come down?? The two most common concerns we hear are:

  1. “I know the market is at an all-time high. I want to sell my investments today and reinvest these dollars when the market crashes in the coming months”. See chart 2 for our typical response.

  2. “I know the market is going to crash. I want to move all my money into something safe like cash or bonds. What do you think I should do?”

If you are someone that is worrying about your investments (maybe it’s something entirely different from the two concerns listed above), please reach out to our team so we can listen to your concerns and build an investment strategy for you going forward. To be frank, the timeline for spending 401(k) dollars impacts the advice we give. For example, we would give different advice to someone planning to spend their 401(k) savings soon than to someone in their mid-forties with no intentions of spending their 401(k) soon.

2: What About This Looming Market Crash?

If you have setup a 401(k) account, then you are investing your dollars every single pay period. This phenomenon is called dollar-cost averaging and it works really well for most retirement accounts. If you have a 401(k) account, we recommend leaning into dollar-cost averaging, setting up annual account rebalancing, and assessing your account strategy periodically. Of course, this strategy is not one-size-fits-all. Some investors prefer to intervene with their investments if they are predicting an upcoming market crash.

That being said, we recently found this article by Nick Maggiulli that compares gradually investing a consistent dollar amount (like per paycheck 401(k) contributions) to saving dollars up to buy a market dip. Please take the time to read the whole article, but if you want the cliff notes here you are:

  • The article points out that stockpiling cash in anticipation of a market crash is an unlikely strategy to win out in the long run.

  • Trying to buy the dip usually fails because large dips are rare. As a result, the strategy turns into stockpiling cash which is not a good idea for the long-term.

  • If you do want to try and buy the dip, think about getting your cash invested in the stock market as soon as possible.

For some help interpreting this chart, here is the text directly from Nick Maggulii’s blog post. “This chart shows that there is roughly a one in four chance of beating DCA when using a Buy the Dip strategy with a 10%-20% dip threshold. If you were to use a 50% dip threshold, the chance of outperforming DCA increases to nearly 40%. But this doesn’t come without a cost. Because while you are more likely to outperform DCA when using a bigger dip threshold, you also underperform by more (on average) as well.”

3: Monthly Child Tax Payments

July 2021 was the beginning of the monthly child tax credit payment for parents. Did you see our 20-minute webinar about the child tax credit, why it matters, and some financial planning considerations for parents?

Flash-forward a few months, and we have found a study of 1,514 American parents who received the monthly child tax credit payments. As you can see, most parents have saved their payments for emergencies which is a disciplined usage of the excess cash.

4: Vanguard Announces Lower Fees for Target Retirement Funds

In late August, Vanguard announced they are lowering the expense ratio (the cost) of their target-date funds by February 2022. We believe this is good news for all investors using Vanguard target retirement funds!

Vanguard will lower the expense ratio to 8 basis points meanwhile they are committed to maintaining the same glidepath methodology and asset allocation.

To articulate the cost savings, we assembled a table showing the potential impact for someone invested in a Vanguard target retirement fund with the updated expense ratio. For someone with $100,000 in a Vanguard target retirement fund, this lowered expense ratio means immediate annual savings. Just to be clear, the $90 vs $80 are annual fees which add up to be meaningful cost savings for you over a long period of time. Cheers!

5: Be Careful who you Get Advice From

How many self-proclaimed market savants are sharing their opinions with the world? So many! Be careful who you listen to. We couldn’t help but include some humor in this post. Feel free to relish in the ridiculousness of this chart.

That concludes our Charts of Q3 2021 post. We will be assembling the next Charts of the Quarter post before we know it. Take care! — Your Human Investing Team


signature-HI Team-401k-2021 copy.png
 

Related Articles

S&P Stock Market Performance and Capital Gains Tax Increases
 
wall st.jpg

Many of our blog articles are inspired by conversations we have throughout the week. This article on the S&P 500 stock market performance and capital gains tax increases is no exception. The question we are being asked is, "what do you think is going to happen with the market if capital gains go up?" Our recent response has been, "let us do some research and circle back to you." Here is what we found:

  1. Federal capital gains tax rates are currently near 70-year lows

  2. The proposed bill (House Ways & Means Committee, September 13, 2021) increases the top capital gains rate from 20% to 25% on income above $400,000.

  3. The previously proposed rate was 39.6% but kicked in at $1,000,000 of income.

  4. Table 1 below provides a side-by-side of the recent proposal with current capital gains rates and income brackets.

capital-gains-01-table.jpg

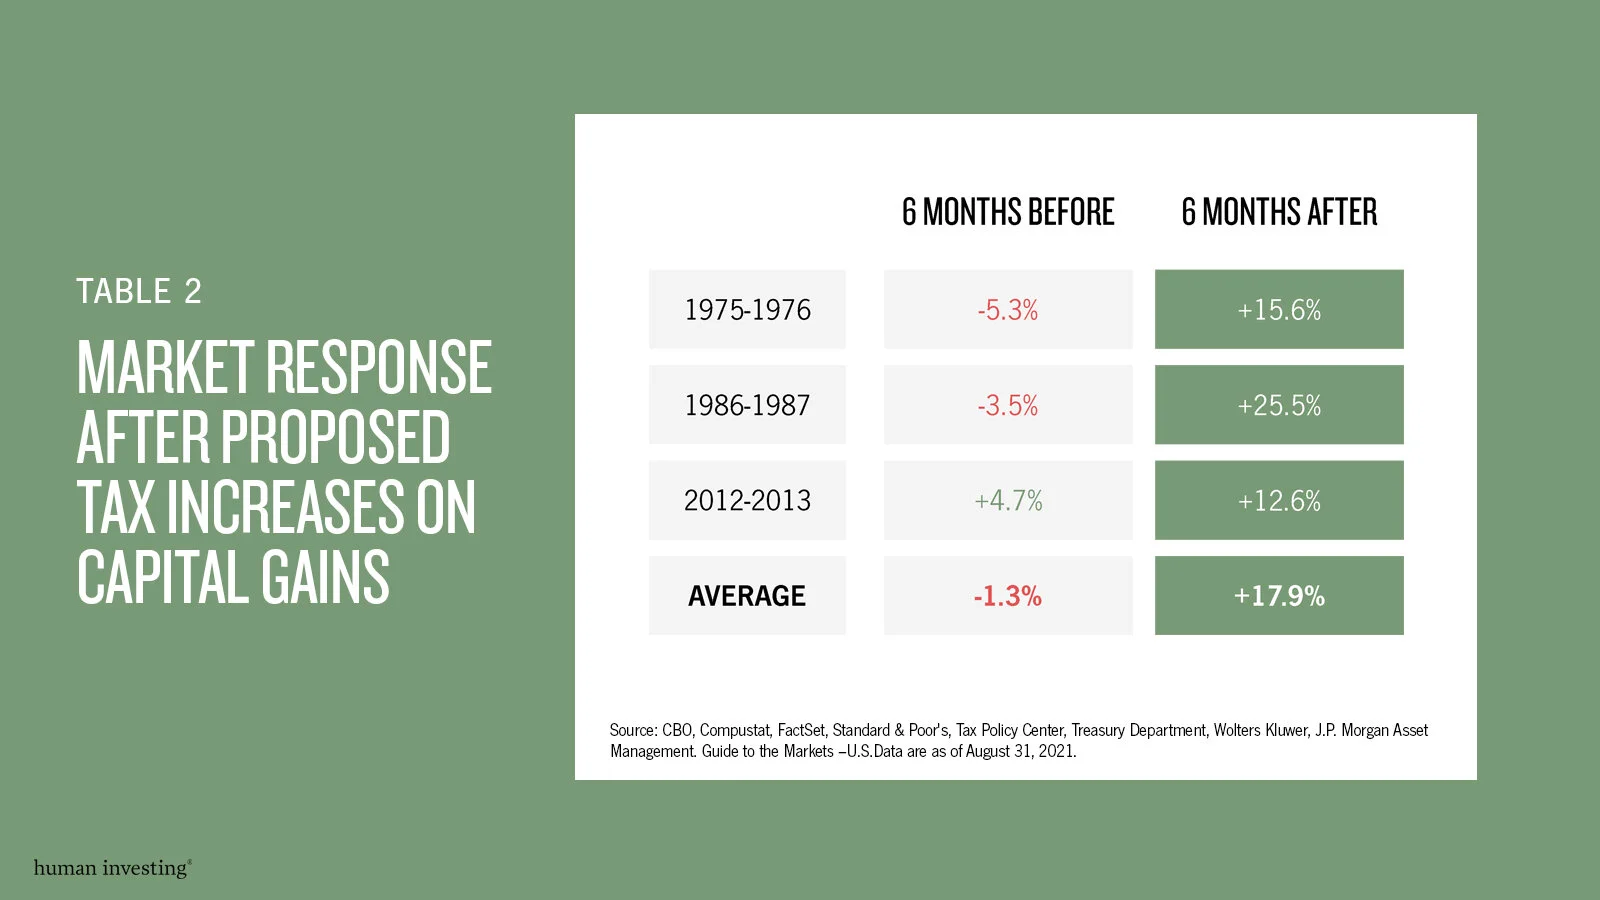
With this background on where rates have been and what is being proposed, we look to address the question, "so what happens to the market when capital gains rates go up?" Table 2 below tells an interesting story. Although there is market anxiety leading up to the proposed capital gain tax change, which results in a negative average return, the six months following the tax increase, the market is favorable. Wait, what? Excuse me for a minute while I reexamine Table 2. Ok, yes, the market is actually up after a proposed tax increase on capital gains.

capital-gains-02-table.jpg

As we have learned from our 25 years advising clients, anything is possible, and history does not always repeat itself. Another lesson learned from experience is that the market does not care about our charts, nor does it give a rip about our attempt to explain what might be. It is nice to know that cap gains tax hikes do not always mean turbulent markets are ahead. In fact, the market has performed above the historical average when a cap gain tax hike is put in place—at least, that is the case for the six months following the increase.


Related Articles

Summary Block
This block has no content yet. Items you add to the page connected to this block will display here.
Charts of Q2 2021
 

Summer is here! We hope you are enjoying the extended daylight and are spending time with family and friends throughout the upcoming months. To recap the past quarter, we are sharing some topical charts with you.

INFLATION

Recently, the US inflation rate reached a 13-year high. As a result, there has been an exhausting number of headlines published about inflation recently. Unfortunately, inflation buzz creates a lot of noise from people trying to predict something that is not predictable. Will interest rates rise? Will there be a surge in US spending or saving? Will more production occur inside the US? As the chart indicates, inflation itself is always fluctuating. Due to the unpredictable nature of inflation, we do not recommend making financial decisions based on headlines.

Source: The NY Times

THE RISE OF GASOLINE PRICES

Remember when oil producers had to find places to store their oil during the early stages of the pandemic? Since then, the price of gasoline has been steadily rising. If you get sticker-shock from filling up your car’s tank of gas, remember that there are many factors that affect oil and gas prices. For example, seasonal demand, commodities speculation, and the value of a dollar all impact gas prices. To reduce the amount of money you spend on gas this summer, we recommend inflating your tires to increase fuel efficiency or simply riding a bicycle this summer!  

Real Estate Prices are Soaring

We included a chart about housing prices in our Q1 Charts post, and for homebuyers there hasn’t been much great news since then. Real estate prices are still surging. For a visual, see the chart comparing the rise of home prices in Portland, Seattle, San Francisco, and the National Case-Shiller index since 2018.

Real estate prices are a result of inventory issues, the heightened cost of lumber for new construction (see chart below), and many people relocating their residency since the pandemic. If you haven’t experienced it yourself, we all know someone who has been outbid on several houses making the home buying experience feel impossible.

The Child Tax Credit Revamp

The Biden Administration revamped the child tax credit for 2021. The updates include a larger credit amount, monthly payments, more age eligibility, and a fully refundable credit. Overall, this is good news for parents. Like most tax code updates, this child tax credit will certainly cause some confusion. These two visuals should help outline the general updates as well as an example of how the updates would impact the fictitious Mohamed family of four.

As you can see, the Mohamed family is expecting to receive both more money and money sooner than they did last year. However, they will receive a $3,000 credit at the time of their tax return compared to $4,000 in 2020. Given the complexities of the new child tax credit, our team will continue to publish information on this topic in the coming months.

Robinhood Reveals Revenue

Robinhood recently publicized their financial statements in preparation for their Initial Public Offering. In their S-1 public filing, Robinhood disclosed that more than 50% of their users are first-time investors. That comes as no surprise given their reputation of being a democratizing platform. Over the past several months, our team at Human Investing has fielded more commentary about investing with Robinhood than ever before.

Prior to the release of the S-1 public filing, it was easy to imagine the average Robinhood investor as someone with a few extra dollars and a desire to buy/sell individual stocks. However, once Robinhood disclosed the breakout of their revenue we can see that most of their earnings (at least in Q1’21) is derived from investors trading options trading options as opposed to buying/selling individual equities.

Source: Robinhood’s S-1

That concludes our Q2 2021 Charts, and we look forward to sharing more charts with you in the coming months.


signature-HI Team.png
 

Related Articles

Biden's New Tax Proposals and What They Mean For You
 

With each presidential election comes a slew of new tax proposals and changes that are sometimes difficult to decode. News outlets mix proposed and enacted laws, furthering the stress that comes with determining how they will affect your taxes.

The biggest takeaway from Biden's new tax law proposals is that those who earn under $400,000 of income per year should not expect to face an increase in taxes. In fact, they are likely to see more tax credits that will help reduce their tax liability. However, those who make above $400,000 could be significantly affected by several of the proposed tax law changes.

Below is an outline of the administration’s current proposals that may become laws in the coming tax seasons based on your yearly income.

for THOSE WHO MAKE BELOW $400,000

What’s been enacted: The Dependent Care Tax Credit.

Eligible childcare expenses increased from $3,000 to $8,000 ($6,000 to $16,000 for multiple dependents) and the maximum reimbursement rate has increased from 35% to 50% for a maximum credit of $8,000. It is refundable for the 2021 tax year. If you pay for childcare services in 2021 for children 12 and under, you can claim those expenses in tax credits up to $16,000.

blog pic 1.png

The Child Tax Credit has temporarily increased from $2,000 to $3,000 per child ages 6-17, and $3,600 per child aged 0-5 for the 2021 tax year. There will also be monthly payments made from July to December 2021. Half the total credit amount will be paid in advance with the monthly payments, while the other half will be claimed on the tax return that you will file next year. For example, if a single filer with an AGI of $60,000 had one 13-year-old child, they would receive $250 per month from July to December and $1,500 as a credit on their 2021 tax return.

blog pic 2.png

The increase (i.e., the extra $1,000 or $1,600) is gradually phased-out for joint filers with an AGI of $150,000 or more, head-of-household filers with an AGI of $112,500 or more, and all other taxpayers with an AGI of $75,000 or more. At $440,000, couples will phase out of the tax credit entirely.

What’s been proposed: First-Time Homebuyer’s Tax Credit reinstated for up to $15,000 in refundable credits.

You may not have owned a home within the last 3 years to qualify for this credit. You must make no more than 160% of the area median income, and the home’s purchase price must be no more than 110% of the area median purchase price. You could claim this credit for primary residences purchased after Dec. 31, 2020.

for Those Who Make Above $400,000

What’s been proposed: Increased income tax

Currently, the top individual income tax rate is set at 37% on earnings above $622,050 ($518,400 for those filing single). The new proposed rate is 39.6% for earnings above $400,000.

blog pic 3.png

What’s been proposed: The 6.2% Social Security payroll tax on income above $400,000.

For 2021, the maximum limit on earnings for withholding of Social Security tax is $142,800. This proposed tax law would result in the 6.2% tax continuing on earned income over $400,000 in addition to the 6.2% tax on earned income up to $142,800. The income between $142,800 and $400,000 would not be subject to this tax. For example, if $450,000 is earned, $50,000 will be taxed at 6.2% resulting in $3,100 paid in SS tax on top of original cap of $8,853.60.

blog pic 4.png

What’s been proposed: Long-term capital gains and qualified dividends be taxed at a rate of 43.4% on income above $1,000,000.

Long-term capital gains above $501,600 ($445,850 for those filing single) is currently taxed at 20%. In addition, they are proposing the elimination of the step-up in basis for transferred assets.

What’s been proposed: Restoration of the limitation on itemized deductions (ie. mortgage interest, charitable contributions, property taxes, etc.) for taxable income above $400,000.

This means your itemized deduction amount would be reduced by the lesser of 3% of AGI in excess of $400,000 or 80% of your itemized deductions. The state and local tax deduction limit of $10,000 could also be removed, allowing for additional deductions in state and local taxes paid above $10k. For example, a person has $750,000 of taxable income, and their itemized deductions total $75,000. 3% of their taxable income above $400,000 = $10,500, 80% of itemized deductions = 60,000. Since the 3% calculation is the lesser of the two, their itemized deduction amount of $75,000 is then reduced/lowered by $10,500, resulting in $64,500 of itemized deductions.

blog pic 5.png

What’s been proposed: Pass-through deductions removed for taxpayers earning more than $400,000.

For business owners of a Sole Proprietorship, Partnership, S-Corporation, and certain trusts and estates, the Section 199A pass-through deduction for qualified businesses could be up to 20%. The maximum deduction is the lesser of 20% of an owner’s QBI, or 20% of taxable income, excluding any net capital gains. If it were to pass, this deduction would no longer be available if the taxpayers net income were above $400k.

What’s been proposed: Estate and Gift Tax exemption rates for assets may be brought back to 2009 rates.

For 2021, the unified federal gift and estate tax exemption is $11.7 million per individual. The tax rate on cumulative lifetime gifts in excess of the exemption is a flat 40% (applicable to taxable amounts above $1 million made while still alive). The estate tax exemption for Married Filing Jointly (2009): $7,000,000. For those filing Single (2009): $3,500,000. The maximum gift tax rate (2009): 45%

BUSINESS AND CORPORATE TAXATION

What’s been proposed: Increased corporate income tax from 21% to 25-28%.

While this may not directly affect your taxes, it may affect any assets you have in company stocks or potential dividends depending on how the corporation decides to deal with the increase in tax.

What’s been proposed: Minimum tax on corporations with $100 million or more in book income.

Corporations would be taxed on the greater of their regular corporate income tax rate or have a 15% minimum tax imposed on them.

It is important to remember that all proposed tax law changes would need to be reviewed and enacted by Congress in order to become official tax law. All proposed law could potentially be revised or eliminated.


Charts of Q1 2021
 

The start to 2021 was eventful for our team at Human Investing. Since the beginning of January, we watched the markets and headlines respond to the capital siege, the GameStop phenomenon, and another stimulus bill. Now that Q1 2021 is over, our team is sharing five of our favorite charts we have seen circulate this quarter.  Enjoy!  

Chart 1: Gamestop

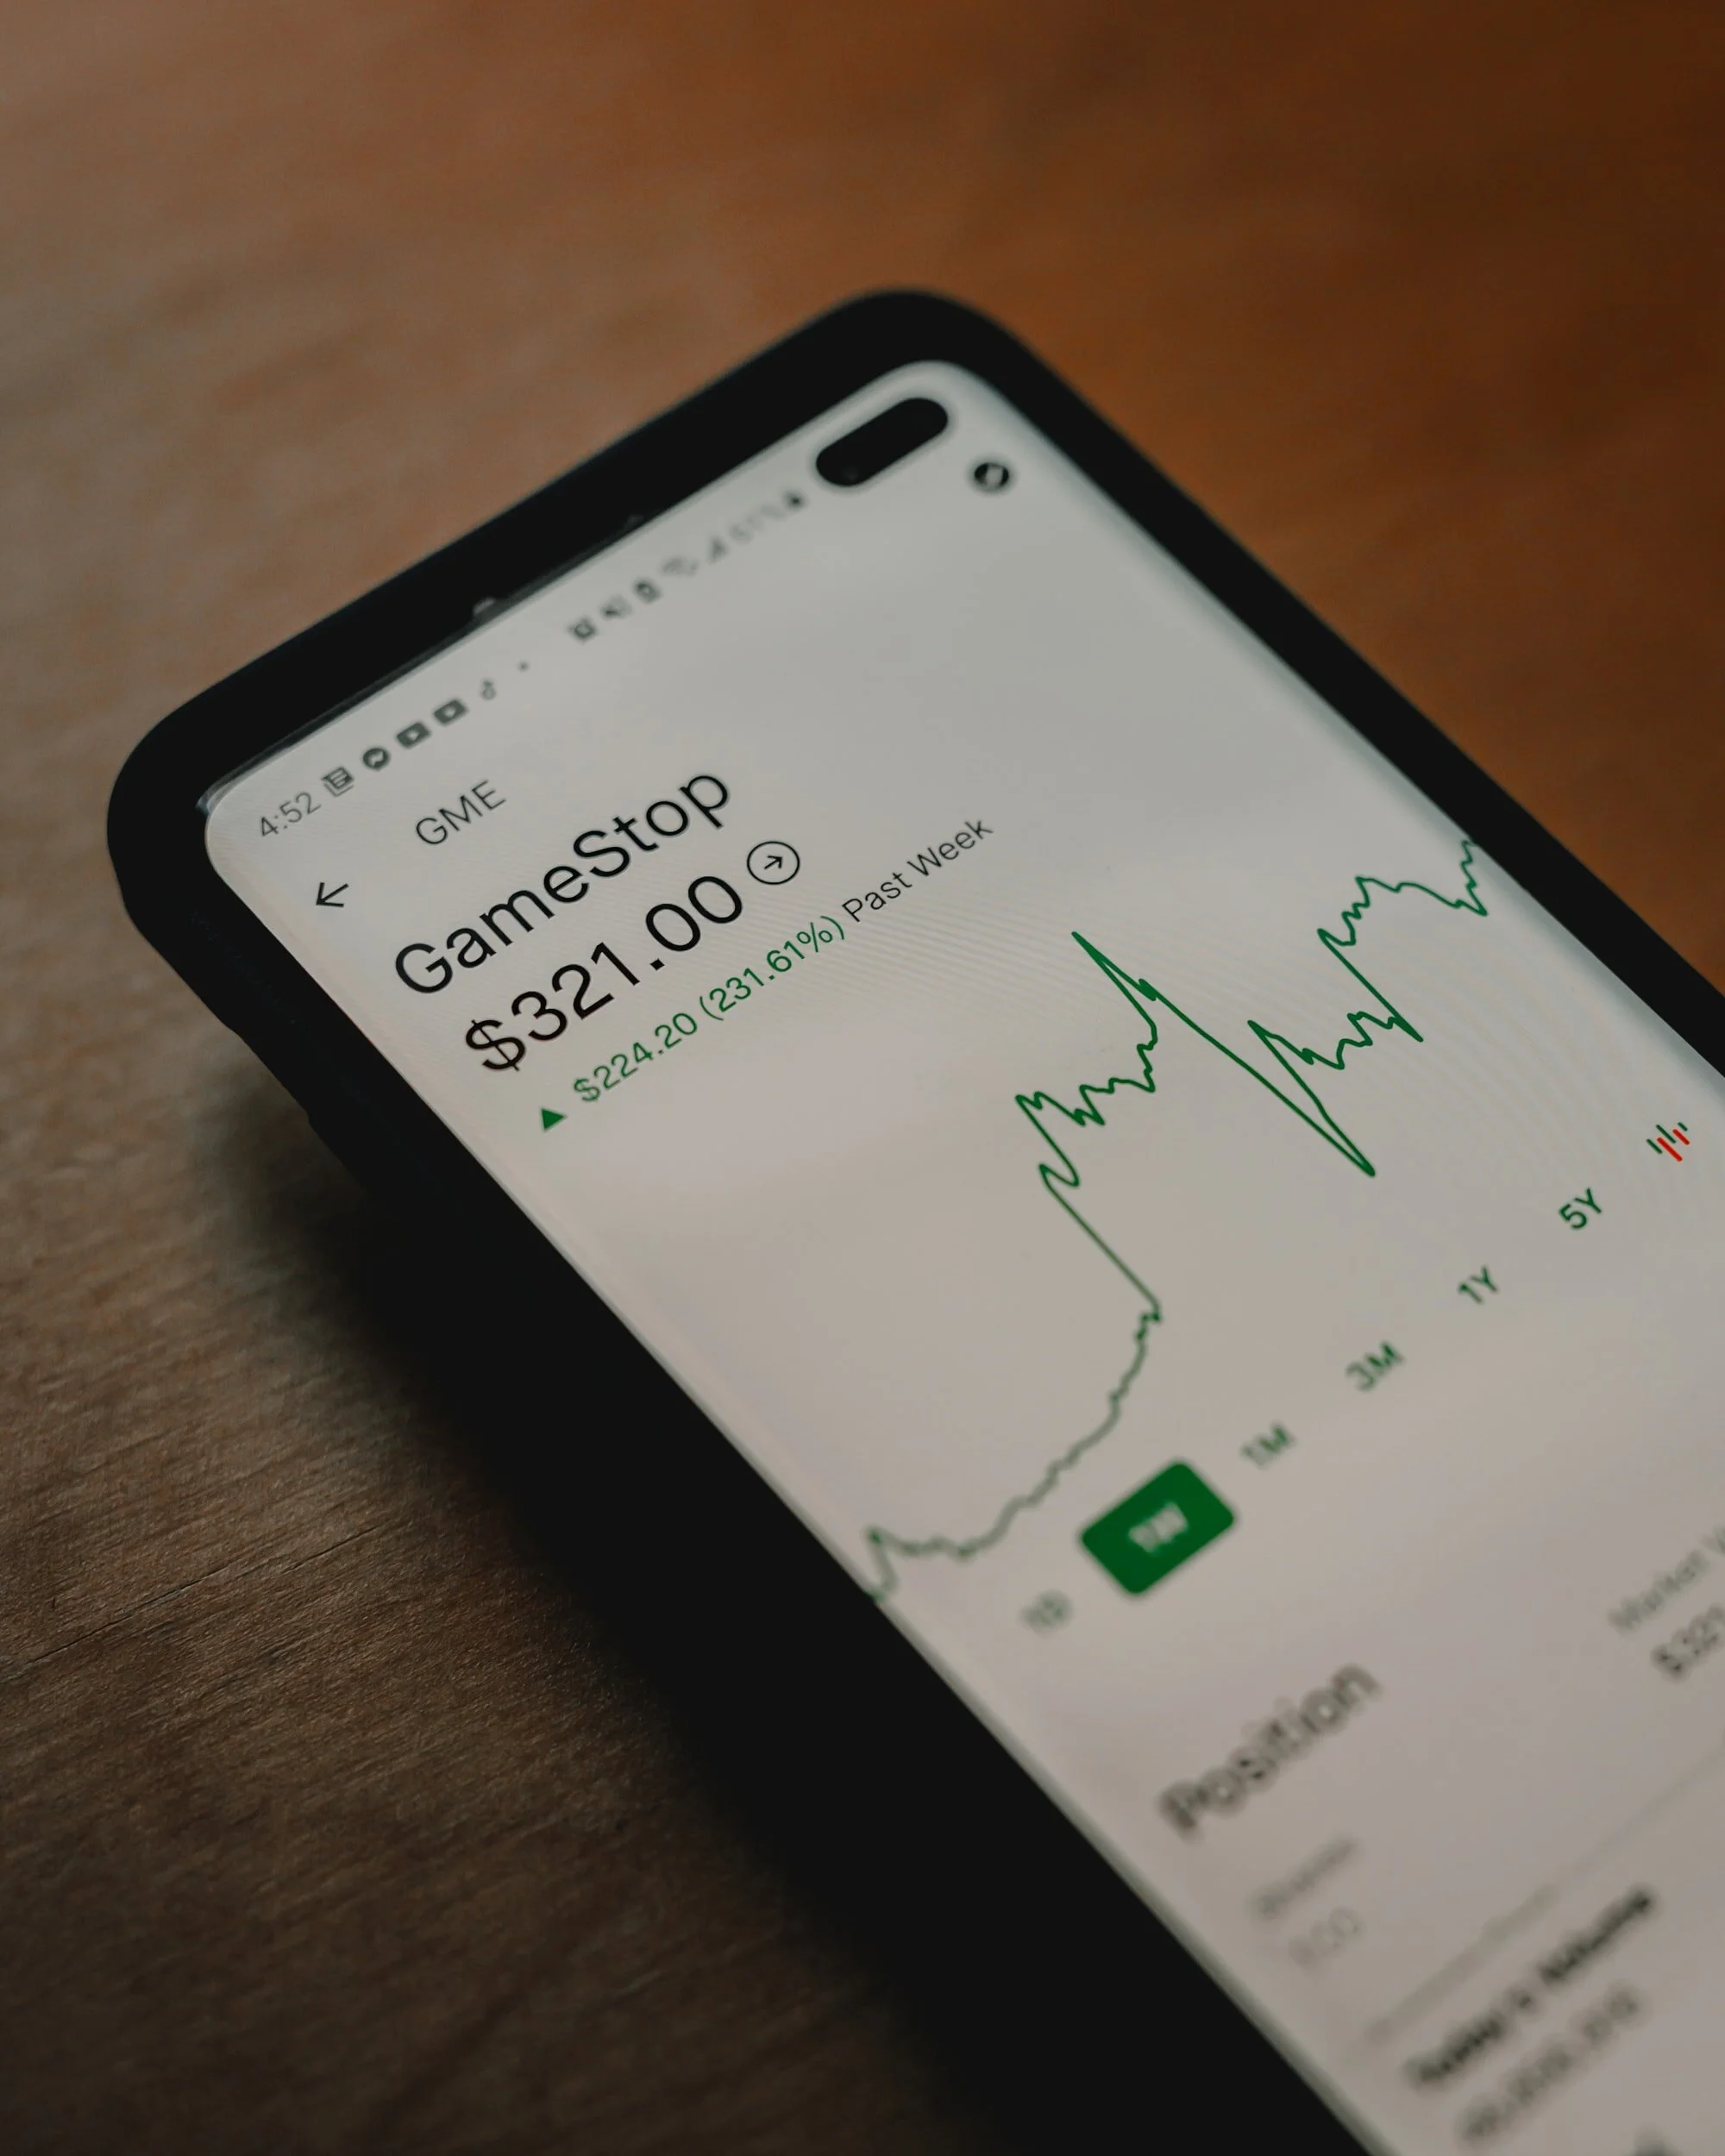
January 2021 was the GameStop month. Even though it seems like this frenzy is over, we expect the GameStop phenomenon to remain relevant in the months and years to come. We are sharing a simple chart that captures both the price spike and trading volume spike.

While there are many takeaways from this short squeeze, one important reminder is to always keep your investment strategy the forefront of your decision-making. When will you be spending your dollars? What will the dollars be spent on? Remember that both your savings and your investment strategies are likely different from your neighbors, your headlines, and your influencers.  

chart-01.jpg

Chart 2: Bull Markets

This chart highlights the annualized returns of recent bull markets.  As illustrated at the bottom, 2020 was an extraordinary year for market returns with an annualized return of 79.4%. This annualized return was not predictable, but it shows the importance of staying invested during a market downturn.

What does this mean for you? Do not take your investment returns this past year for granted! If you have created an investment strategy, stick to your game-plan. Past results do not guarantee similar future returns.

Chart 3: Price Changes

If you attended one of our group presentations recently, then you may have already seen this inflation chart. As illustrated in this chart, we want to emphasize that hospital services and college tuition are 165% more expensive today than in the year 2000. Let this chart be a reminder to plan for these big expenditures. Also, next time you watch TV – give it some appreciation. TV’s are a prime example of a technology that has not only gotten smarter and faster, but also more affordable over the years.

Chart 4: U.S. Savings Rate

This chart visualizes the U.S. Savings Rate before the pandemic, during the height of the pandemic, and the savings rate five months after the stay-at-home orders were released in the US. Notice that the precautionary savings increased significantly in April and May 2020, but has decreased ever since?  We encourage you to review your precautionary or “emergency savings” and to contact our team to strategize ways to make it happen.

chart-04.jpg

Chart 5: Home Sales

As Portland residents, we know how difficult it is to buy a home here. According to Redfin, the median sale price in Portland is up 22.4% year-over-year and the median days on the market is down 67.5%. While this may be a favorable scenario for current home sellers, it is obviously a distressing situation for home buyers. We recommend reading the New York Times article for a full analysis on the national housing inventory and reasons why the number of homes for sale has plummeted.

That concludes our Q1 2021 Charts post. We promise to post our favorite charts from Q2 2021 this summer!  


signature-HI Team.png
 

Related Articles

The Big Short: Volume II Starring $GME
 
image.jpg

Last week GameStop went viral as a topic unlike anything I’d seen in my 10 years at Human Investing. Probably just like you, I googled “Gamma Squeeze”, had someone two degrees of separation from me divulge they had been a part of wallstreetbets, and now have significantly more money, and felt like I was watching a version of March Madness play out real-time in the financial markets.

With the introduction of free trading and the gamification of trading stocks with apps like Robinhood, this past week was the culmination of many factors colliding (more on that later). Different than in The Big Short (2008 Real Estate Crisis) where select hedge funds were taking advantage of large investment banks being overleveraged in the housing market, this time it was retail investors taking advantage of hedge funds overleveraged in GameStop. If Michael Lewis or someone else isn‘t writing this book already I’d be shocked, and I can’t wait for the movie too.

Most of the questions our team has been fielding this week looked like a version of:

  • Why GameStop?

  • Why now?

  • Explain this to me like I’m 5

  • Is this a one-time occurrence or is something like this going to be happening more frequently?

  • And probably most importantly what does this mean for me, my investments, and the markets as a whole?

To help me answer some of these questions I’ve enlisted our head analyst, Andrew Gladhill. In our office known as Glads. For those of you who haven’t spoken with Glads or seen his work, he’s a CFA and anyone who knows him would most likely have him on their Who Wants to be Millionaire “phone a friend” shortlist. Maybe most importantly, one of the ways Glads makes our team better is being able to take complex topics and break them down in very digestible terms. Take it away!

Some key terms you need to know

Shorting

The short answer: Shorting is betting that a price will go down (not up), and you benefit as the price goes down. For example, if you short a stock trading at $20, and it goes down to $15, you have made $5.

The long answer: Shorting works through a few steps:

  • Step 1 – you borrow the stock today from someone who holds the stock (Let’s call them Emily) with a set date you must return the stock back to Emily. Emily lends you the stock because Emily charges you interest.

  • Step 2 – you sell the stock today (say for $20)

  • Step 3 – you must return the stock to Emily, plus interest (say $1) buying it at the current market price to do so (say $15)

  • In this example, you have made $4 (Sold for $20, bought for $15, charged $1 interest)

Why do you short? Because you believe something is overvalued, and you want to profit from when the price goes down.

short-selling copy.jpg

Short Squeeze

The short answer: When a shorted position has the price increase, those who are shorting it (the shorters) are forced to buy the position, driving the price up further.

The long answer: If the price rises on a short position, the shorter starts losing money. They can either hedge their losses by buying the stock before the return date, or wait to buy and hope the price falls. Remember, the shorter must return the stock to the original owner by a set deadline. Because the price of the stock can rise higher and higher, the shorter’s potential loss is limitless.

So a short squeeze is when the price of a company goes up because lots of people are buying a heavily shorted stock, increasing the price. The rise in price causes some shorters to close out their positions, which involves buying the stock. More buying activity causes the price to increase, causing greater losses for the shorters. If the price rises high enough, the losses get large enough that more shorters are forced to close out their short position to avoid having their total portfolio value go negative. This creates a positive feedback cycle of buying activity, pushing the stock price even higher.

cycle.jpg

Why WAS Gamestop ($GME) TARGETED?

The Short answer: GME had an unusually high amount of shares sold short, allowing the short squeeze to be possible. Retail investors gathered online & decided to try to make it happen.

The Long Answer: Short float is the number of shares sold short (borrowed & then sold) that have not yet been repurchased. Gamestop had a short float over 100%, meaning some shares of Gamestop had been lent out more than once. This happened because many believed Gamestop (a retail video game store) was the next Blockbuster and would go out of business. The share price would go to $0 a share, and they would profit from the price dropping. Some retail investors noticed the high short float on GME in an online community known as reddit wallstreetbets (aka WSB, aka retail investors). The retail investors saw an opportunity for a short squeeze due to the large short interest, and GME being a relatively small company.

The retail investors planned to force a short squeeze on GME. The retail investors would buy up as many shares of GME as possible, driving up the price. The retail investors would hold their shares, drying up the supply, pushing the price up even further. All this upward price movement would force a short squeeze, driving the price up even further, and the positive feedback cycle would result in astronomical price increases for GME as the short squeeze hits. Retail investors will be able to sell their shares at high prices to the shorters forced to closing out their position.

Why was trading restricted?

The short answer: Companies that execute trades (brokerages, i.e. Robinhood) must have money to cover trade differences with clearing firms (the back end companies that finalize trades) as collateral. The rapid, unexpected movement in GME brought some brokerages ability to do that into question, and they had to pause the trading until they could secure more funding.

The long answer: When you sell or purchase a stock, that trade isn’t finalized until settlement, which is 2 days later. This time is used to verify the transfer of cash & the security purchased. It’s like when you deposit a check at the bank, the bank makes sure the check clears before you can withdraw cash. Clearing firms finalize stock transactions. The brokerages (i.e. Robinhood, Fidelity, Schwab, e-Trade) are required by law to maintain cash deposits as collateral with clearing firms to cover any losses. The required deposits by the clearing firms for the brokerages went up because GME was having higher price volatility. Some brokerages had to pause trading in GME while they secured enough funding to make the deposits required by the clearing firms. The financial system rarely handles meteoric rises in stock prices in such a short amount of time, and certain parts of the system that normally work so smoothly we never think about them suddenly brought trading to a screeching halt.

what does this mean for me and my portfolio?

Thank you, Glads. This story and its ramifications are certainly not finished. As more details come out it will continue to paint a clearer picture of what it means for investors over the past week and looking forward as well. To bring this all home and answer the question, “what does this mean for me and my portfolio” a few thoughts:

While Gamestop took up all the headlines this past week, for most investors it had little to no impact on their portfolio. For example, the Vanguard Total Stock Market Fund (VTI), is a staple in many retirement accounts across the country, the fund was down 3.59% last week (in line with the market). GameStop contributed a positive 0.04% return to the fund (basically nothing!) despite being up nearly 655% on the week, a bi-product of how small of a company GameStop is relative to other companies in the fund that truly move the needle.

vanguard.jpg

So should I get in?

Should you open up a trading account in preparation of the next public short-squeeze? The boring/correct answer is this is not the forum to be giving specific financial advice for your specific situation. If you’re truly speculating about that and want to talk to it through, PLEASE sign up for a Calendly link with one of our advisors and they are happy to talk with you about it.

My favorite book I’ve read in the past few months is The Psychology of Money by Morgan Housel. It’s one of the best (in my opinion) personal finance books because it focuses on behavior (potential controllable actions) rather than guessing what’s the next best stock is. He has an entire chapter devoted to the topic of, “People have a tendency to be influenced by the actions of other people who are playing a different financial game than they are.” This is the case for most people saving for retirement when thinking about GameStop, shorting, and what we’ve seen in the news. It’s Human to feel like you missed on an opportunity with GameStop and to want to hit it big on the next trade. But most likely that’s not your game.  Most likely your game (and mine too) involves saving and investing for a long time, letting compounding interest take care of the rest, and maybe most importantly staying out of your own way. And while that game doesn’t create the same headlines, as Housel writes in a different chapter it can create a different type of headline to aspire to.


Related Articles