Posts in Current Events
Rebalancing – What is it, and Why Does it Matter?


Rebalancing is the idea that you are bringing your investment portfolio back to its targets. For example, if you invest your account as 60% stocks and 40% bonds (60/40) and never trade, in ten years your account will not be 60% stocks. Because stocks have historically tended to perform better than bonds over most ten-year periods, you will likely have a higher weight of stocks than bonds after ten years. If you don’t rebalance, your portfolio may not align with your intended allocation, which could change the risk and return characteristics.

WHY is it NECESSARY

Deciding how much to invest in various asset classes is a critical determinant of long-term performance[1]. Since asset allocation matters, maintaining it through rebalancing matters. As we’ve written previously, over time stocks typically outperform bonds[2]. There are also certainly times bonds outperform stocks, usually in recessions. The logic of rebalancing boosting returns is simple: You are selling what has relatively outperformed and buying what has underperformed (buy low, sell high). Especially in today’s world, where most ETFs are commission free, making the transaction costs of rebalancing minimal. Taxable investors should consider the tax implications of rebalancing, and also consider the change in risk and return of not rebalancing.

TWO APPROACHES

In financial theory, there are two main approaches to rebalancing: calendar-based and tolerance-based.

Calendar-based rebalancing ensures the long-term risk-return profile of your portfolio is consistent. This gets implemented on a set frequency (monthly, quarterly, annually) and ensures a consistent cadence.

Tolerance-based rebalancing takes advantage of buy low, sell high opportunities as they arise. This assumes you rebalance only if you hit certain thresholds of one asset class over or under performing. For example, say your target is 60/40, and you set a 3% absolute tolerance; if the equities drift to 64%, that prompts a rebalance back to 60/40. The alternative is relative tolerances, the same percentage of the target for each piece of the model. So, if a 60/40 portfolio had a 20% relative tolerance, the equities would be rebalanced if off by a relative 20% (20% of 60% target = 12% tolerance) and the bonds would have a 4% tolerance for rebalancing. There has been research suggesting tolerance-based rebalancing is more beneficial for long-term performance[3].

OUR PROCESS

At Human Investing, we combine both calendar-based and tolerance-based rebalancing to give our clients the best of both worlds. Tolerance rebalancing allows us to take advantage of market dips and rallies as they happen, while our annual reviews ensure no portfolio drifts too far off course. This approach keeps every account aligned with the level of risk and return our clients expect and provides discipline, consistency, and confidence over the long run.

While rebalancing can sometimes feel counter intuitive, like selling bonds and buying stocks in March 2020, it is a helpful practice for any investor. It both keeps your portfolio consistent in the long run, and may improve risk-adjusted returns over time.


[1] Ibbotson, R. G., & Kaplan, P. D. (2000). Does Asset Allocation Policy Explain 40, 90, or 100 Percent of Performance? Financial Analysts Journal56(1), 26–33. https://doi.org/10.2469/faj.v56.n1.2327

[2] https://www.humaninvesting.com/450-journal/equity-risk-premium

[3] Daryanani, Gobind (2008). Opportunistic Rebalancing: A New Paradigm for Wealth Managers. FPA Journal. January 2008.

Disclosure: This material is provided for informational and educational purposes only. It should not be construed as investment, legal, or tax advice, nor does it constitute a recommendation or solicitation to buy or sell any security. Investors should consult with a qualified financial professional before making any investment decisions. Rebalancing and asset allocation strategies do not ensure a profit or protect against loss in declining markets. There is no guarantee that any investment strategy will achieve its objectives. Any references to historical performance, academic studies, or research are based on past data and should not be considered indicative of future results. Past performance is not a guarantee of future outcomes. Advisory services offered through Human Investing, an SEC-registered investment adviser.


 

Related Articles

A Big Tax Break for Retirees: How To Put the New $6,000 Deduction To Work Before It’s Gone


On July 4, the One Big Beautiful Bill Act (OBBBA) became law, as a broad tax and spending package aimed at easing inflation and delivering financial relief to Americans. One of the most notable provisions for retirees is a new $6,000 “senior bonus deduction” for individuals age 65 and older.

The $6,000 bonus deduction is available to all eligible seniors, whether they take the standard deduction or choose to itemize. This is different from the age-based standard deduction, which is only allowed if you take the standard deduction.

Unlike the age-based standard deduction, this new bonus stacks on top of your existing deductions, making it one of the most generous tax breaks retirees have seen in years.

Here’s what’s changing and how to take advantage of it in your retirement plan.

How the stacked tax deduction will work

Starting for tax year 2025, taxpayers age 65 and older will be able to combine:

  • A standard deduction of $15,750 (single) or $31,500 (married filing jointly), with

  • An age-based addition of $2,000 (single) or $1,600 per spouse if married, and

  • A new $6,000 senior bonus deduction under the OBBBA.

That means a single filer over 65 could deduct up to $23,750(previously $16,550). A married couple where both spouses are 65 or older could deduct $46,700 (previously $32,300).

The catch?

Eligibility is income-based. The full deduction is available to those with modified adjusted gross income (MAGI) up to $75,000 for single filers or $150,000 for joint filers. The deduction begins to phase out once above those thresholds and is fully phased out at $175,000 for single filers and $250,000 for joint filers.

It’s also worth noting that this senior bonus deduction is temporary. As of now, it only applies for the 2025 through 2028 tax years. It’s possible Congress could extend it further, but we likely know until 2028.

Why It Matters: Five Planning Opportunities Worth Exploring

This deduction will reduce taxes for many retirees. But its real value lies in the doors it opens for proactive planning. Here are several strategies we’re helping clients explore:

1. Rethinking Roth Conversions

Roth conversions allow you to shift money from traditional IRAs to Roth IRAs, paying tax now to enjoy tax-free withdrawals later. The bonus deduction gives retirees more room to convert IRA dollars at lower effective tax rates.

By combining the standard deduction, the age-based addition, and this new $6,000 bonus, some retirees may be able to convert dollars each year with minimal tax impact. This can lower future required minimum distributions (RMDs), reduce lifetime taxes, and create more income flexibility down the road.

There’s a sweet spot between retirement and RMDs where this approach can have the most impact.

2. Smoothing Income Over Multiple Years

Retirees often experience uneven income from asset sales, business wind-downs, or large IRA distributions. With this senior bonus deduction in place for four years, now is the time to think about spreading income more evenly across tax years, so you can qualify for this deduction while it’s available.

To make the most of the deduction each year from 2025–2028, consider ways to spread income more evenly across those years:

  • Delaying large sales or distributions to avoid spiking above the income threshold in a single year.

  • Accelerating income from future high-tax years into lower-income years.

  • Using multi-year tax projections to identify the optimal path.

This smoothing strategy can help avoid unnecessary spikes in tax liability while making full use of the available deduction each year.

Same Income, Different Results - This chart compares two retirees, each with an average annual income of $160,000 over four years.

  • Uneven Income: Income spikes in 2026 and 2028 push this retiree above the $175,000 phaseout limit, causing them to miss out on the $6,000 deduction in two years. Total lost deductions: $12,000

  • Smoothed Income: By spreading income more evenly across all four years, this retiree stays under the threshold and qualifies for the full $6,000 deduction every year.  Total deductions preserved: $24,000

Strategic income timing can preserve valuable deductions, even when total income stays the same.

3. Funding the Cashflow Gap Before Claiming Social Security

Delaying Social Security often results in higher lifetime benefits. The challenge is funding those interim years. The senior bonus deduction provides a helpful cushion, allowing retirees to generate income from taxable or IRA accounts without incurring as much tax.

This deduction could help bridge the gap, making it easier to delay Social Security while keeping tax costs under control.

4. Revisiting Withdrawal Order

The traditional guidance suggests pulling from taxable accounts first, then IRAs, and Roth accounts last. But with this expanded deduction, it may be worth adjusting that sequence.

You might instead:

  • Draw more from IRAs early, taking advantage of low tax rates and the temporary senior deduction. You’re essentially using the government’s tax break to convert IRA assets into spending money at a low cost. This can also reduce future IRA balances (and future taxable RMDs).

  • Reserve taxable accounts for later, especially after the senior bonus deduction expires.

  • Preserve Roth assets for high-income years or future tax flexibility.

Coordinating withdrawals across all account types with the new deduction in mind can improve long-term tax efficiency.

5. Aligning With Charitable Giving

If you’re charitably inclined, this is a good time to revisit your giving strategy.

Qualified Charitable Distributions (QCDs) from IRAs remain a powerful tool to give directly to charity without increasing taxable income. This also keeps your MAGI lower, which may help you stay under the $250k Joint/$175k Single threshold to qualify for the senior bonus deduction.

For others, donor-advised funds can be used to bunch gifts in one year to claim a high itemized deduction, then take advantage of the standard deduction in the next. In both cases, retirees can still benefit from the new $6,000 bonus deduction each year they qualify.

This new deduction adds flexibility, helping you give with greater intention and less tax friction.

Bottom Line

If you’re 65 or older, the next few years offer a unique window of opportunity. From 2025 through 2028, this new deduction can help lower your tax bill today and create long-term planning advantages that stretch well into the future.

It’s a reminder that good tax laws are only as valuable as the plans they inspire. Used thoughtfully, this expanded deduction can help you reduce lifetime taxes, generate tax-efficient income, and leave a stronger legacy.

The next four years offer a rare opportunity to rethink how you generate income in retirement. Whether you're considering a Roth conversion, adjusting withdrawal strategies, or supporting causes you care about, we’re here to help you build a plan that puts this deduction to work.


Disclosure: This material is for informational and educational purposes only and is not intended as personalized tax, legal, or investment advice. You should consult your own tax, legal, and financial professionals before making any decisions based on the information provided. Tax laws and regulations are subject to change, and their application can vary based on your individual circumstances. While the strategies discussed may be appropriate for some individuals, there is no guarantee that any specific tax outcome or investment result will be achieved. Any examples, scenarios, or case studies are hypothetical and for illustrative purposes only. They do not represent actual client situations and should not be relied upon to predict or project results. Investing involves risk, including the potential loss of principal. Past performance does not guarantee future results. All investments and tax strategies carry certain risks and may not be suitable for all investors. Advisory services offered through Human Investing, LLC, an SEC registered investment adviser.

 

Related Articles

What the One Big Beautiful Bill Act Means for Your Taxes


Signed into law July 2025, the One Big Beautiful Bill Act brings a wave of tax changes including bigger deductions, new savings tools, and key incentives. Whether you're filing as an individual, managing a household, or running a business, understanding these updates is key to maximizing your benefits and minimizing surprises. Here’s what you need to know.

All U.S. taxpayers

The following provisions affect all U.S. Taxpayers with most taking effect for calendar year 2025, and a few scheduled to begin in 2026.

Tax Brackets Remain Unchanged

With the One Big Beautiful Bill Act (OBBBA), federal income tax brackets remain intact, and are set to be permanent for the future. The seven marginal rates continue to be:
10%, 12%, 22%, 24%, 32%, 35%, and 37%.
More importantly, these rates did not revert to their pre-2018 levels, which were generally higher for many income brackets. 

Bigger Standard Deductions for Everyone – Starting 2025

The OBBBA raises the standard deduction amounts across all filing statuses:

- Married Filing Jointly: $31,500 (up from $30,000)

- Single: $15,750 (up from $15,000)

- Head of Household: $23,625 (up from $22,500)

Charitable Giving for Non-Itemizers – Starting 2026

Under the new law, everyone is able to have a tax benefit for making charitable contributions.

If you normally don’t itemize your deductions during tax time you can now deduct your charitable contributions:

- Up to $2,000 for joint filers

- Up to $1,000 for others

Tip:  If you typically don’t itemize, there may be tax planning opportunities near year-end to move your charitable contributions into January 2026 to get a better tax benefit.

Clean Energy Incentives Update – Ending 2025

The 30% federal tax credit for residential solar and battery storage systems expires on December 31, 2025. To qualify, your system must be fully installed and operational by that date, there’s no grace period or retroactive eligibility. If your project is underway, be sure to complete it before year-end 2025 to claim the full credit.

Elimination of Federal Clean Vehicle Tax Credits – Ending September 2025

The federal tax credits for clean vehicles are being phased out earlier than expected. If you are planning to purchase an EV and qualify for the credit, you must do so by September 30, 2025 to claim it. These credits will not be renewed or extended under the new law.

Trump/MAGA Accounts – Starting 2025

These are new savings accounts for children, modeled after IRAs but designed specifically for minors. Each child born between Jan. 1st, 2025 and Jan. 1st, 2029 will automatically receive an account with a $1,000 government contribution to help jumpstart long-term savings.

Contributions

Parents can contribute up to $5,000 per year until the child turns 18. Funds must be invested in ETFs and grow tax-free for qualified uses like education, a first home, or starting a business.

Distributions

Funds are partially accessible at age 18 for qualified expenses, with full access at age 25. After age 30, funds can be used for any purpose without penalty. Early, non-qualified withdrawals before age 30 are subject to tax and a 10% penalty.

Estate & Gift Tax Exemption – Starting 2026

Before the One Big Beautiful Bill Act, the estate and gift tax exemption was set to drop from $13.99 million to $7.2 million per person in 2026 due to the TCJA sunset, OBBBA permanently raises it to $15 million per person starting in 2026, indexed for inflation.

For taxpayers making $500k or less

SALT Deduction – Starting 2025

Under the OBBBA, if you have an Adjusted Gross Income (AGI) under $500,000 you are eligible to deduct up to $40,000 in state and local taxes, including income tax or sales tax, and property taxes from your federal taxable income. This expanded cap is in effect for five years through 2029 and offers a significant increase from the previous $10,000 limit.  For many Oregonians, this is seen as a win, with Oregon being a high-income tax state.

Tip: Careful planning can help maximize this deduction. To take full advantage of the increased limit, consider:

  1. Paying your full 2025 property tax bill within the 2025 tax year, if feasible.

  2. Making your Q4 estimated state income tax payment due January 15, 2026 by December 31, 2025. This ensures it counts toward your 2025 deduction cap of $40,000 and helps preserve the full benefit if your AGI is under $500,000.

Taxpayers with AGI over $500,000 can still deduct state and local taxes, but the $40,000 cap is reduced by 30% of the amount exceeding $500,000, with a minimum deduction of $10,000. At $600,000 AGI, the deduction is reduced by $30,000, bringing it down to the $10,000 floor. Note: This effectively creates a high-income tax bracket between $500K and $600K (45.5%) if you are itemizing. These rules remain in effect through 2029.

Child Tax Credit (CTC) – Starting 2025

The CTC has increased to $2,200 per qualifying child through 2028, after which it reverts to $2,000; the credit is nonrefundable and phases out for AGI above $400,000 MFJ and $200,000 for others.

Enhanced Deductions for Taxpayers Age 65+ - Starting 2025

A new $6,000 bonus standard deduction is available for taxpayers aged 65 and older, but it begins to phase out at AGI of $150,000 MFJ ($75,000 Single) and phases out completely once above $250,000 MFJ ($175,000 Single).

Tip: Careful planning around Roth conversions is recommended, as such conversions increase AGI and could reduce or eliminate eligibility for the bonus deduction. 

Tip: To help remain under these thresholds, taxpayers aged 70½ or older can make a Qualified Charitable Distribution (QCD) from their IRA to a qualified charity. This counts towards their annual Required Minimum Distribution (RMD) while excluding the amount from taxable income, and preserving eligibility for deductions under OBBBA.

Car Loan Interest Deduction – Starting 2025

If you purchased a new car with financing anytime in 2025, you may qualify for a deduction of up to $10,000 if the following apply:

  • Your adjusted gross income (AGI) is below $250,000

  • The vehicle was brand new and assembled in the United States

  • You purchased the car (not leased it)

This deduction applies only to interest paid on the loan and is designed to support domestic manufacturing and personal vehicle ownership.

For Business Owners

Section 179 & Bonus Depreciation – Starting 2025

- 100% bonus depreciation is back (for assets placed in service after January 19, 2025) and is now made permanent by the Act.

- Expense limit: $2.5M

- Phaseout threshold: $4M

Qualified Business Income (QBI) Deduction – Starting 2026

- OBBBA proposed raising the QBI deduction to 23%, but the final law kept it at 20%. However, it increased the phaseout thresholds to $150,000 for MFJ and $75,000 for others up from $100,000 and $50,000, respectively. These changes will take effect in 2026.

- $400 minimum deduction if you have at least $1,000 in business net income.

Employer Student Loan Help – Starting 2026

- Employers can contribute up to $5,250/year tax-free toward paying off student loans. Limitations may apply.

Excess Business Losses – Starting 2026

- Cap: $500K (joint) / $250K (others).

- Losses above this become net operating losses and are carried forward to future years.

The OBBBA reshapes the tax landscape for nearly every American. Whether you're a parent saving for your child’s future, a retiree managing income thresholds, or a business owner investing in growth, the new law offers expanded opportunities and new complexities. With many provisions taking effect in 2025 and 2026, now is the time to review your financial plan, optimize deductions, and take advantage of available tools.


Disclosure: The information presented herein is for educational and informational purposes only and is not intended to be construed as personalized tax, legal, or investment advice. Tax laws and financial regulations are subject to change, and the implications of the One Big Beautiful Bill Act may vary based on individual circumstances. Please consult a qualified tax professional or financial advisor before making any decisions based on this content. Advisory services offered through Human Investing, an SEC registered investment adviser.

 

Related Articles

When Everything Feels Risky, are U.S. Treasuries Still the Answer?


Every few years, a familiar worry resurfaces: Can we still trust U.S. Treasuries?

It’s a fair one. Fiscal deficits are rising. Government debt dominates the headlines. Political theatrics are hard to ignore. These concerns are understandable.

But this piece is not a dismissal of those worries. It aims to weigh them against the steady role Treasuries continue to play in global markets and in investors’ portfolios.

Because the key, as always, is to separate signal from noise. And noise is never in short supply.

U.S. Treasuries are often described as “risk-free.” Of course, no investment truly is, but no other assets have earned that reputation as convincingly. Their strength is structural: deep markets, global demand, and the dollar’s central role in international finance. These aren’t passing features. They’re foundational pillars of a system that continues to hold.

WE’VE BEEN HERE BEFORE

Concerns about the national debt are nothing new. In the mid-1980s, Congress passed the Gramm-Rudman-Hollings Act in response to growing fears of a looming fiscal cliff.¹

That was nearly 40 years ago.

Since then, warnings have echoed: interest rates would skyrocket, the dollar would collapse, foreign buyers would flee. But none of those predictions played out in a sustained way. Interest rates stayed low for decades. The dollar remained strong. Treasuries continued to anchor global portfolios.

THE OTHER SIDE OF THE LEDGER

Most debt conversations focus on the total amount owed, but it would be wise to consider both sides of the ledger. An equally important story is the government’s ability to repay what it owes.

The United States has a broad and resilient tax base, drawing revenue from some of the world’s most profitable corporations and wealthiest individuals. In 2024, over 94 percent of federal revenue came from income, payroll, and corporate taxes.²

That revenue base gives the government something that matters more than the size of its debt: flexibility. The capacity to raise more if needed. This is a critical ingredient in maintaining trust and stability in U.S. Treasuries.

That doesn’t make debt a non-issue. But it puts the conversation in better context.

THERE IS NO SUBSTITUTE

Some point to shifting foreign ownership of Treasuries as a sign of trouble. But the truth is, global capital needs a home that is safe, liquid, and capable of absorbing trillions in flows. There are few alternatives.

That’s why central banks, sovereign wealth funds, and even the U.S. tri-party repo market continue to rely on Treasuries. ³,⁴ It is not because of short-term politics. It is because no other asset plays the role as effectively or as consistently.

Foreign holdings may ebb and flow with trade dynamics or currency shifts. But the long-term, strategic demand? It’s still there.

HIGH DEBT DOES NOT GUARANTEE CRISIS

Japan offers an interesting counterpoint. With a debt-to-GDP ratio over 250%, more than double that of the United States.⁵,⁶ And yet, its financial system remains stable, and interest rates are close to zero.

This is not to suggest that debt is irrelevant, but it serves as a useful reminder that high debt levels, on their own, do not lead to crisis. The surrounding structure, including credibility, strong institutions, and consistent demand, matters just as much, if not more.

Could Treasuries someday lose their special status? In theory, yes. Anything is possible. But if that day ever comes, it will likely coincide with a much broader breakdown in global order. In that kind of environment, the safety of any asset would be in doubt.

That’s not a prediction. It’s simply an observation about the scale of disruption required to unseat the U.S. Treasury market.

A WARNING FROM ‘THE BOND KING’

Not everyone views Treasuries as the unshakable anchor they once were. Even some of the most seasoned investors are questioning the long-term role of U.S. Treasuries.

Jeffrey Gundlach, CEO of DoubleLine Capital and one of the most influential fixed income investors of the past two decades, has voiced serious concerns. In a June 2025 interview, he offered this warning:

“There is an awareness that the long-term Treasury bond is not a legitimate flight-to-quality asset.”⁷

He points to shifting dynamics: the dollar falling during selloffs, long bond yields rising after rate cuts, and growing concern over rising interest costs. As low-yield bonds mature, they are being replaced by debt with much higher yields. According to Gundlach:

“The interest expense for the United States is untenable if we continue running this budget deficit and continue to have sticky interest rates.”

Gundlach raises legitimate questions. But even he stops short of calling Treasuries broken. His concern is about strain, not collapse. The system is being tested, not undone.

While the pressures are real, rising interest rates and persistent deficits, they are not set in stone. Policy can change. Priorities can shift. The system still has tools it can use.

And this is where perspective matters.

Markets are noisy. Bad news sells. Loud warnings travel further than quiet resilience. But alarm does not erase the quiet strength of systems that continue to function.

Even Gundlach points to stress, not failure.

Which brings us back to what still works.

STILL DOING THEIR JOB

Treasuries aren’t immune to worry, however they continue to serve their purpose. They provide liquidity, offer stability, and act as a counterbalance in times of uncertainty.

We’re seeing that play out again in real time. Renewed tensions with Iran have reminded investors what uncertainty feels like. Once more, yields have dropped and the dollar has strengthened. These are clear signs of a flight to safety.

Even amid rising deficits and political noise, Treasuries continue doing what they’ve always done: deliver reliability in a world that often falls short.

References:

  1. U.S. Congress. Balanced Budget and Emergency Deficit Control Act of 1985 (Gramm-Rudman-Hollings Act). Public Law 99–177, 99th Congress, December 12, 1985.

  2. U.S. Department of the Treasury. “Government Revenue.” Fiscal Data – America’s Finance Guide.Accessed June 20, 2025.

  3. Board of Governors of the Federal Reserve System (U.S.). “Rest of the World; Treasury Securities Held by Foreign Official Institutions; Asset, Level [BOGZ1FL263061130Q].” FRED, Federal Reserve Bank of St. Louis. Accessed June 20, 2025.

  4. Federal Reserve Bank of New York. “Tri-Party Repo Data Visualization.” Federal Reserve Bank of New York. Accessed June 20, 2025.

  5. U.S. Department of the Treasury. “National Debt and Debt-to-GDP Ratio.” Fiscal Data – America’s Finance Guide. Accessed June 20, 2025.

  6. World Economics. “Debt-to-GDP Ratio: Japan.” World Economics. Accessed June 20, 2025.

  7. Jeffrey Gundlach, interview with Bloomberg, “Gundlach on Treasuries, Gold, Fed, AI, Private Credit, Trump,” June 11, 2025.


Disclosure: Advisory services offered through Human Investing, an SEC registered investment adviser. This material is for informational and educational purposes only and is not intended as investment advice, an offer, or a solicitation to buy or sell any securities. Past performance is not indicative of future results. All investments involve risk, including the potential loss of principal. Any third-party opinions or sources cited are believed to be reliable but are not guaranteed for accuracy or completeness. Please consult your financial professional before making any investment decisions.

 

Related Articles

2024 Q4 Economic Update: Earnings 101 and What Do They Mean For Investors?


When it comes to a company’s stock, earnings are at the heart of its value. A company’s earnings represent its profitability—the actual money it makes after covering all costs—and this bottom line directly influences its stock price. Understanding earnings is key for investors because they reveal how well a company is performing today and provide insight into its potential growth. Let’s break down what earnings really mean and how they impact the value of the stocks you own.

What are earnings?

Earnings are the net income or profit for a business. Publicly traded companies report their earnings every three months in a document called the “net income statement,” which they must submit to the SEC (Securities and Exchange Commission). To find a company’s earnings, you can look up their 10-Q or 10-K filings on the SEC website.
 
Earnings are reported quarterly and are typically compared to the previous quarter and the same quarter from the previous year to show how profits are growing or shrinking. Companies will also release annual earnings, summarizing their financial year. There are also earnings calls where company leaders (like the  CEO or CFO) will discuss recent financial results, and provide guidance for the future.

What determines earnings?

Earnings start with total revenue (the money a company brings in). Then, all the costs are subtracted to see how much profit remains. Some of the main cost categories:

  • Cost of Good Sold (COGS): Raw materials and labor to make the product

  • Sales, General, and Administrative (SG&A): All the costs to keep the company running not involved in making the product. Think human resources, accounting, or marketing

  • Depreciation: This tracks the decrease in value of physical items (like machines) over time.

  • Amortization: This is the decrease in value of non-physical items (like patents) over time.

  • Interest: This is what a company pays on its loans (outstanding bonds)


How should I think about earnings?

Think of earnings as a pie. The total size of the pie represents a company’s total profits. Each slice of the pie shows how much profit belongs to each share of stock. Earnings per share (EPS) measures the profit each share would get if the earnings were divided up evenly. For example, Nike (NKE) had $1.051 billion in net income in August 2024, resulting in EPS of $0.70 per share. Meanwhile Ford (F) had a higher $1.831 billion in net income June 2024. Because Ford has more shares outstanding than Nike, EPS came out lower at $0.456 per share.
 
When evaluating how expensive a single company stock is, investors look at the Price to Earnings (Price/Earnings or P/E) ratio. It’s a measure of how much someone is paying for every dollar of profit at the company. If you expect the company to grow a lot, you should be willing to pay a much higher P/E ratio than for a stable, established company that isn’t expected to grow. Looking at the P/E ratio is a much better way to get a sense of if a company is cheap or expensive. Stock prices reflect both the total earnings and future growth expectations (i.e. the size of the pie) and the number of shares out there (i.e. how big is each piece of the pie).

How do earnings impact stock prices?

Most publicly traded companies have earnings expectations, which is the average of what the professional analysts who track the company expect earnings to be for the next quarter (and beyond). Companies that exceed expectations have a positive surprise, and usually see their stock price go up in response. Conversely, companies that miss earnings (i.e. report lower earnings than expected, or reduce growth expectations) usually see their stock price decline.
 
Stock market reactions to earnings can sometimes seem unpredictable. For example, a company will beat earnings (i.e. report higher earnings than the analysts expected), but they didn’t beat earnings by as much as they did last quarter, so the stock price drops. Expectations can be so low for some companies any positive earnings surprise sends the stock soaring.

Many critique earnings as a measure of stock price. It’s possible to change accounting practices where the reported earnings number is higher, but the increase is more to do with changes in accounting policies than actual business activity. Extreme cases of manipulation can lead to fines and forcing companies to reissue earnings.

What do earnings do for me, the investor?

Earnings represent the company’s profits, which can benefit investors in two main ways:

  1. Reinvest back into the company: typically done by growing companies, sometimes the best use for extra cash is to put more money back into the company to grow

  2. Payout to investors: typically done by stable, established companies. The stockholders are the owners of the company, so the company returns the earnings to the investors in the form of dividends or stock buybacks

In traditional finance theory, the reason you own stock in a company is that your ownership means you will get the earnings returned to you in the form of dividends. Theoretically, any change in stock price is a change in the expected total dividends you’ll receive over the life of the company. While there can be lots of noise around stock prices (economic outlook, new leadership, etc.), ultimately the expectations around earnings (and thus dividends to investors) is the root of stock price fluctuations.
 
Whether your own stocks individually or through a broadly diversified fund, understanding how earnings impact stock price can be a helpful way to evaluate their long-term opportunity.


Related Articles

2024 Q3 Economic Update: Equity Risk Premiums


We’re all familiar with the risk-reward tradeoff: Do I risk injury to compete in a sport I love and feel fulfilled by? Do I risk leaving a stable job to pursue a career that excites me? It’s not surprising that this everyday phenomenon is also very present in our investment portfolios.

For example, there are three asset classes that an investor typically includes in their portfolio: cash, bonds, and stocks. Of the three, stocks can generate the greatest return but also merit the highest risk. On the other hand, a risk-free investment guarantees a future return with essentially no possibility of loss. An example of a risk-free investment is US Treasury bills, as they are backed by the full faith and credit of the US government. If investors are taking on more risk by investing in stocks, they want to know their efforts are worth it. Enter the equity risk premium.

Understanding the Equity Risk Premium

The equity risk premium measures how much more an investor may receive in returns when investing in stocks versus a risk-free investment like T-bills. Basically, it puts a number to the term, “the higher the risk, the higher the reward”.

As we’ve previously written, the fear of financial loss causes many investors to be overly cautious about their investments. ”Myopic loss aversion” is when focusing on avoiding short-term losses in equities leads to poor long-term allocation decisions.  Incorporating bonds into your investment portfolio can serve as  a stabilizer, reducing the payback period to see your portfolio recover from downturns. Many investors own some combination of stocks and bonds to ensure the risk-reward tradeoff is an acceptable range for them, either emotionally or financially (or both). Because of the fear of loss, many investors either avoid or under-weigh equities. How significant is the difference between owning stocks (highest risk), bonds (lower risk), or cash (no risk)?

Risks associated with investing in Stocks

So, why do those who invest in stocks generally receive a greater return? Because of the greater risk they take on by doing so, such as:

Unpredictability: Stocks do not offer fixed payments at specific intervals like bonds.

When an investor buys a bond, they are essentially lending money to a company or a government (see our Bonds 101 blog for a primer on bond basics). Like any loan, bonds have terms outlining specific payment amounts and dates. These payments, known as coupons or interest, are obligatory, with insolvency being the only reason for non-payment.

Conversely, stocks represent ownership in a company and entail greater uncertainty. Returns for stock investors can come in the form of dividends distributed by the company or by selling shares at a higher price in the future. Unlike bond payments, dividends are not mandatory and can be suspended unexpectedly, as seen during the onset of the COVID-19 pandemic. Additionally, the growth of dividends may not meet expectations, even for well-established companies commonly known as “blue chip” stocks (such as Coca-Cola, McDonalds, or Microsoft). Even large and stable companies face challenges that can cause fluctuations in their stock prices. Due to the unpredictability of stock payouts in terms of amount and timing, investing in stocks is inherently riskier and more volatile. As a result, investors demand higher returns from equities as compensation for bearing this additional risk.

Risk of Total Loss: Stockholders can see their investment go to zero more easily than bond investors.

Over the last thirty years, bondholders have frequently recouped 40% or more of their initial investment during bankruptcies, although exact recovery rates can vary[1]. In contrast, equity owners seldom receive any compensation in bankruptcy. The harsh reality is that most companies fail in the long term, and many of these companies made interest payments on bonds throughout their existence, while equity investors ultimately see their investments become worthless. Regardless of whether you’re investing in stocks or bonds, owning a broad index fund provides essential diversification. Owning a basket of companies ensures that even if one fails, the other companies that continue to grow offset your losses so you’re never experiencing a complete wipeout.

The Equity Premium at Play Can Sometimes be a Jackpot

First, a quick note: All return figures mentioned below are based on real returns, or returns after adjusting for inflation. Real returns are the most accurate comparison across different asset classes, reflecting changes in purchasing power over time. Although nominal returns are widely used in the financial world unless otherwise specified, they do not account for inflation and are therefore less accurate in this example. All returns are based on rolling 12-month periods, meaning this is the return if you held the investment for 12 months.

Table 1 - Real returns, rolling 12 month periods - (1926-2023, adjusted for inflation)[2]

When we look at the real returns for the last 97 years between cash, bonds, and equities, it’s clear stocks deliver the highest returns, albeit with the most downside risk. Cash is undeniably the safest asset class but struggles to outpace inflation. Bonds tend to be closer to cash than equities in terms of their risk-return profile.

The Long-Term Power of the Equity Premium for an Investor

While stocks undoubtedly offer the highest returns, it’s essential to grasp their long-term value to investors. To demonstrate this, let’s outline a hypothetical scenario:

  • Assume three investors each save $5K annually for 40 years for retirement for a total contribution of $200K per investor.

  • We’ll assume each investor owns only a single asset class (cash, bonds, or stocks) for all 40 years of saving.

  • We’ll use the real return averages from Table 1 for each asset class.

  • We’ll utilize the commonly cited 4% annual withdrawal rate[3] for retirees to determine how much income the portfolio provides in retirement annually.

Table 2 – Portfolio values assuming real returns

The difference in portfolio value, and resulting income possible in retirement, is significant. A pure equity investor ends up with nearly six times the spending power of a pure bond investor after 40 years.

While equity market volatility can be unsettling, exposure to equities can significantly reduce the amount of savings required to achieve your financial goals such as funding retirement. It’s critical to ensure your equity allocation is sufficient to facilitate asset growth yet small enough to prevent panic during market downturns. Striking this balance depends on your emotional risk tolerance and financial capacity for risk.

Determining the optimal equity and bond allocation requires careful consideration of factors such as taxes, time horizon, and liquidity needs. If you are seeking guidance in navigating this complex process, please reach out to us at 503-905-3100, or email hi@humaninvesting.com to start the conversation.

Sources

[1] https://www.spglobal.com/ratings/en/research/articles/231215-default-transition-and-recovery-u-s-recovery-study-loan-recoveries-persist-below-their-trend-12947167

[2] These returns are based on an index, do not represent actual investment results, and are not guarantees of future results.

Data based on rolling 12 month returns, with monthly return intervals.

Equity returns utilize the Ibbotson SBBI Large-Cap Stocks Total Return for Jan 1926 to Sep 1989 (data courtesy of CFA Institute), and S&P 500 TR for Oct 1989 to Dec 2023 (data courtesy of YCharts).

Bond returns utilize the Ibbotson SBBI US Intermediate Term Government Bonds Total Return for Jan 1926 to Apr 1996 (CFA Institute), and Bloomberg US Aggregate for May 1996 to Dec 2023 (YCharts).

Cash returns utilize the Ibbotson SBBI US (30-Day) Treasury Bills for Jan 1926 to May 1997 (CFA Institute), and Bloomberg US Treasury Bills 1-3 Month for Jun 1997 to Dec 2023 (YCharts).

Inflation rates for calculating real returns are based on the Ibbotson SBBI inflation for Jan 1926 to Jan 1947 (CFA Institute), and the Consumer Price Index (CPI) for Feb 1947 to Dec 2023 (YCharts).

[3] https://www.financialplanningassociation.org/sites/default/files/2021-04/MAR04%20Determining%20Withdrawal%20Rates%20Using%20Historical%20Data.pdf


Related Articles

Q2 2024 Market Note: Preparing for the Presidential Elections & Fed Policy


Between Fed Policy and the Presidential election, 2024 has all the makings to derail investors. While these factors introduce volatility and uncertainty, historical insights and a sound financial plan can guide those navigating the financial markets.

The year began promisingly, with the market reaching all-time highs in the first quarter of 2024. However, the start of the second quarter has highlighted the inherent unpredictability of the financial landscape. Beneath these surface-level fluctuations lies a geopolitical landscape marked by pivotal events that demand attention.

Fed policies will continue to impact market dynamics

The Federal Reserve's stance on interest rates emerges as a significant factor shaping market sentiment and performance in 2024. Speculation about potential adjustments in interest rates can significantly influence investor behavior and market dynamics. Lower interest rates can stimulate economic activity and boost equity valuations. However, uncertainties surrounding the timing and magnitude of such policy shifts add complexity to the investment landscape. At the beginning of the year, the Fed indicated it might cut rates at some point in 2024. But with inflation remaining higher than expected, it's now anticipated that there will be fewer rate cuts (if any) than initially predicted.

The "cost of admission": lessons from decades of market turbulence

Regardless of the headlines, it's fundamental to understand that the path to stock market growth is paved with bumps in the road. The following chart from JP Morgan nicely illustrates how volatile the stock market can be over short periods of time. In the chart, grey bars represent the returns for each calendar year, while red dots show the intra-year declines.

Looking back to 1980, the S&P 500 experienced an average sell-off of 14.2%, while ending positive in 33 of the 44 years measured. This inherent market fluctuation underscores the “cost of admission” for those seeking long-term gains through stock investments.


Insights from past elections: market performance amid political uncertainty

In most years, the stock market experiences growth, and this pattern holds true for presidential election years as well. However, investors should be prepared for increased volatility due to market uncertainty. Over the past four decades, election years have witnessed heightened market volatility fueled by the ambiguity surrounding political transitions. Despite this turbulence, historical data illustrates the market's resilience.

The S&P 500 has delivered a median total return of 11% over the past ten election cycles, inclusive of the 2008 Global Financial crisis. Though slightly lower than the median return of 15% across all years since 1984, this resilience showcases the market's ability to weather political flux.

Despite the uncertainty surrounding elections, historical data indicates that remaining invested through the election has proven advantageous. Once election results are announced, returns often speed up, usually boosting equity valuations and prices post-Election Day regardless of election outcome.

Leveraging a well-crafted plan for stability

During market turbulence driven by factors such as Federal Reserve policies and elections, a well-crafted financial plan acts as a stabilizing force. As we journey through 2024, it's essential to acknowledge that fluctuations are inherent in investing. Stress-testing your financial plan against various scenarios becomes vital, providing resilience in the face of uncertainty. While headlines may evoke strong emotions, maintaining a long-term perspective grounded in a robust plan aids in navigating choppy waters.

As 2024 unfolds, investors are reminded to stay committed to their financial plan's principles. By drawing on historical insights and adhering to a clearly defined strategy, investors can confidently maneuver through market volatility, knowing that their financial plan serves as their guiding star, directing them toward their long-term objectives.

Sources

  1. Human Investing. (2024). 2024 Q1 Economic Update: Politics and the Market. Human Investing Blog. Retrieved from https://www.humaninvesting.com/450-journal/q1-2024-economic-update

  2. Goldman Sachs. (2024, February 1). Global Macro Research. Retrieved from [https://www.goldmansachs.com/intelligence/pages/2024-the-year-of-elections-f/report.pdf]

  3. J.P. Morgan. (2024). Guide to the markets: March 31, 2024.


Related Articles

2024 Q1 Economic Update: Politics and the Market


Welcome to 2024

It’s an election year and America will vote in November for a new Congress and President. Regardless of the election outcome, some investors will be pleased, while others will be disappointed. This article will help investors understand how the markets have been influenced when different political parties take control of both Congress and the Presidency. Looking at data from 1926 through 2023, the main conclusion is straightforward:

Over time the markets tend to rise, regardless of which party controls the White House or Congress.[1]

What impact does the President have on the stock market?

Democratic presidents have overseen slightly higher stock returns compared to Republicans. However, this difference is minor and not considered statistically significant. The variance in stock returns under different political parties can be attributed to the random chance of who happened to be in power at a given time. The reality is the US economy is vast and intricate, making it challenging for any individual, even a powerful figure like the President, to completely control its direction.

A recent example is the presidential election of 2016. The general expectation was for Hillary Clinton to win. When Donald Trump unexpectedly secured victory, initial market reactions led to a decline. By the following day’s market close, markets had not only recovered from the dip but ended up positive on the day. It’s hard to know how the market will respond to unexpected information, and it’s equally difficult to predict what impact a President may have on the stock market.

What impact does Congress have on the stock market?

On the other end of the federal government, a Republican-controlled Congress has typically overseen the best stock market returns. The differences are minor enough that there’s no certainty which party controlling congress (or a split) is best for the stock market.

Congress can be the more impactful part of the federal government in the long run. Executive actions are easily overridden day one by a President from the opposing party taking office. Legislation tends to be more enduring due to the requirement for a larger number of people to be involved. It’s important to note that the effects of legislation may take years to become apparent. This time lag makes it extremely challenging to pinpoint and attribute specific policies to their respective impacts on the ever-evolving dynamics of the market.

What about the White House and Congress combined?

When you widen your lens to encompass both the White House and Congress, the narrative remains consistent. Markets tend to go up irrespective of political control.

Regardless of the federal government’s control scenario, markets go up more often than they go down

As the 2024 elections unfold, we urge investors to remember that investing is a marathon, not a sprint. Position your portfolio to be successful in the long run, enabling it to weather unexpected changes from any source. Both parties have experienced periods of positive and negative returns while in power. Despite the inevitable changes in government, companies exhibit resilience and innovation, consistently discovering avenues to yield returns for their investors. In the intricate dance of politics and markets, a steadfast and forward-looking investment approach proves to be the key to enduring success.

Sources:

[1] Equity returns are monthly returns for the Ibbotson SBBI US Large-Cap Stocks Total Return for Jan 1926 thru Oct 1989 (data courtesy of the CFA Institute & Morningstar Direct), and the S&P 500 Total return for Nov 1989 thru Dec 2023 (data courtesy of YCharts)

Data for which party controlled both houses of Congress and the presidency is from the history.house.gov website (https://history.house.gov/Institution/Presidents-Coinciding/Party-Government/)

Changes to Congress and the Presidency are assumed to occur Jan 1st of odd years. A split Congress indicates that each party controls either the House or Senate, but neither party controls both.

Appendix: Bonus Chart 📈


Related Articles

2023 Q4 Economic Update: Labor’s impact on the economy


In recent months, I’ve been pondering the US labor force and how it has changed in the last five years. Amid the ongoing conversations surrounding inflation and the Federal Reserve's (aka The Fed) recent decisions to raise interest rates to manage inflation, I don’t want to neglect the other part of The Fed’s dual mandate: the dynamics of unemployment and the labor force. Prior to COVID-19, unemployment was at 3.5%, the lowest rate in the last 50 years. Today unemployment is around 3.8%, and has been 4% or lower since December 2021, significantly below the median unemployment of approximately 5% the US has experienced over the last 25 years. Since March 2021, job openings have consistently surpassed the number of job seekers.

Unemployment is often considered an indicator of an economy’s health. Like inflation, you want some unemployment, but not too much. Too high unemployment indicates a weak economy. If unemployment is too low, high inflation becomes a concern. Businesses seeking to grow may be constrained because of a lack of workers, limiting overall economic growth.

Strong employment is a major reason why 2023 has not experienced the recession that many feared at the beginning of the year. I wanted to delve into the reasons behind the tight labor market, what can be done about it, and what this signifies for the overall economy.


Labor’s impact on the current economy

The fundamental assumption in most economic models is that production is constrained by two primary inputs: labor (i.e. workers) and capital (i.e. technology). While technology has yielded significant advances in productivity, the necessity for a workforce to drive economic growth remains. A shortage of labor would imply slower economic growth, potentially resulting in reduced stock market growth.

Concerns persist regarding automation displacing jobs. Some have even proposed the implementation of a universal basic income due to the scarcity of employment opportunities resulting from automation (as exemplified by former presidential candidate Andrew Yang, who made this a central theme of his campaign). A variation of this concern has been present for over a century.

The latest development in automation centers around AI potentially increasing productivity to the extent that we might encounter a surplus of labor. Numerous case studies illustrate that technological change does not always materialize as successfully or rapidly as initially projected. A decade ago, there was much buzz about how autonomous cars were poised to revolutionize the world. Substantial progress has been made, but the challenge of perfecting driverless cars has proven more intricate than many had anticipated. (An example is Moral Machine, where you weigh in on how a self-driving car should navigate situations where the car must choose who to protect in an unavoidable collision).

Another illustration can be found in the excessive optimism at the peak of the dot-com bubble. While the internet did transform the way we work and introduced new efficiencies, it took significantly longer than what people in 1999 had envisioned. Forecasting the timeline for technological change impacting worker productivity is challenging.

If I had to guess, I would anticipate that in the near term (i.e. the next 5 years), we will continue to experience a tight labor market that will be a headwind to growth, for the economy and the stock market.

Retiring baby boomers present a significant challenge

By 2030, the youngest Baby Boomers will turn 65. The average American retires at 64. These retiring Baby Boomers possess the most expertise and would ideally be succeeded by Gen X workers with slightly less experience. However, Gen X is too small of a generation to fully replace the baby boomers, and Millennials & Gen Z broadly lack the experience necessary to fully replace the skills of retiring baby boomers.

This is backed by recent projections by the Bureau of Labor Statistics (BLS), showing that total employment is expected to grow by only 0.3% annually for the next decade, with a significant constraint being the slower growth of the working age population. Slowing growth in labor likely means slowing growth in GDP and stock prices.

Furthermore, there has been a consistent decline in the labor force participation rate over time. This is a measure of everyone 16 and older who is not in the military or an institution (due to criminal activity, mental health, or aging). Part of this reflects the aging population. As the proportion of the population beyond retirement age increases, a smaller segment of the population remains in the workforce.


How can we increase labor?

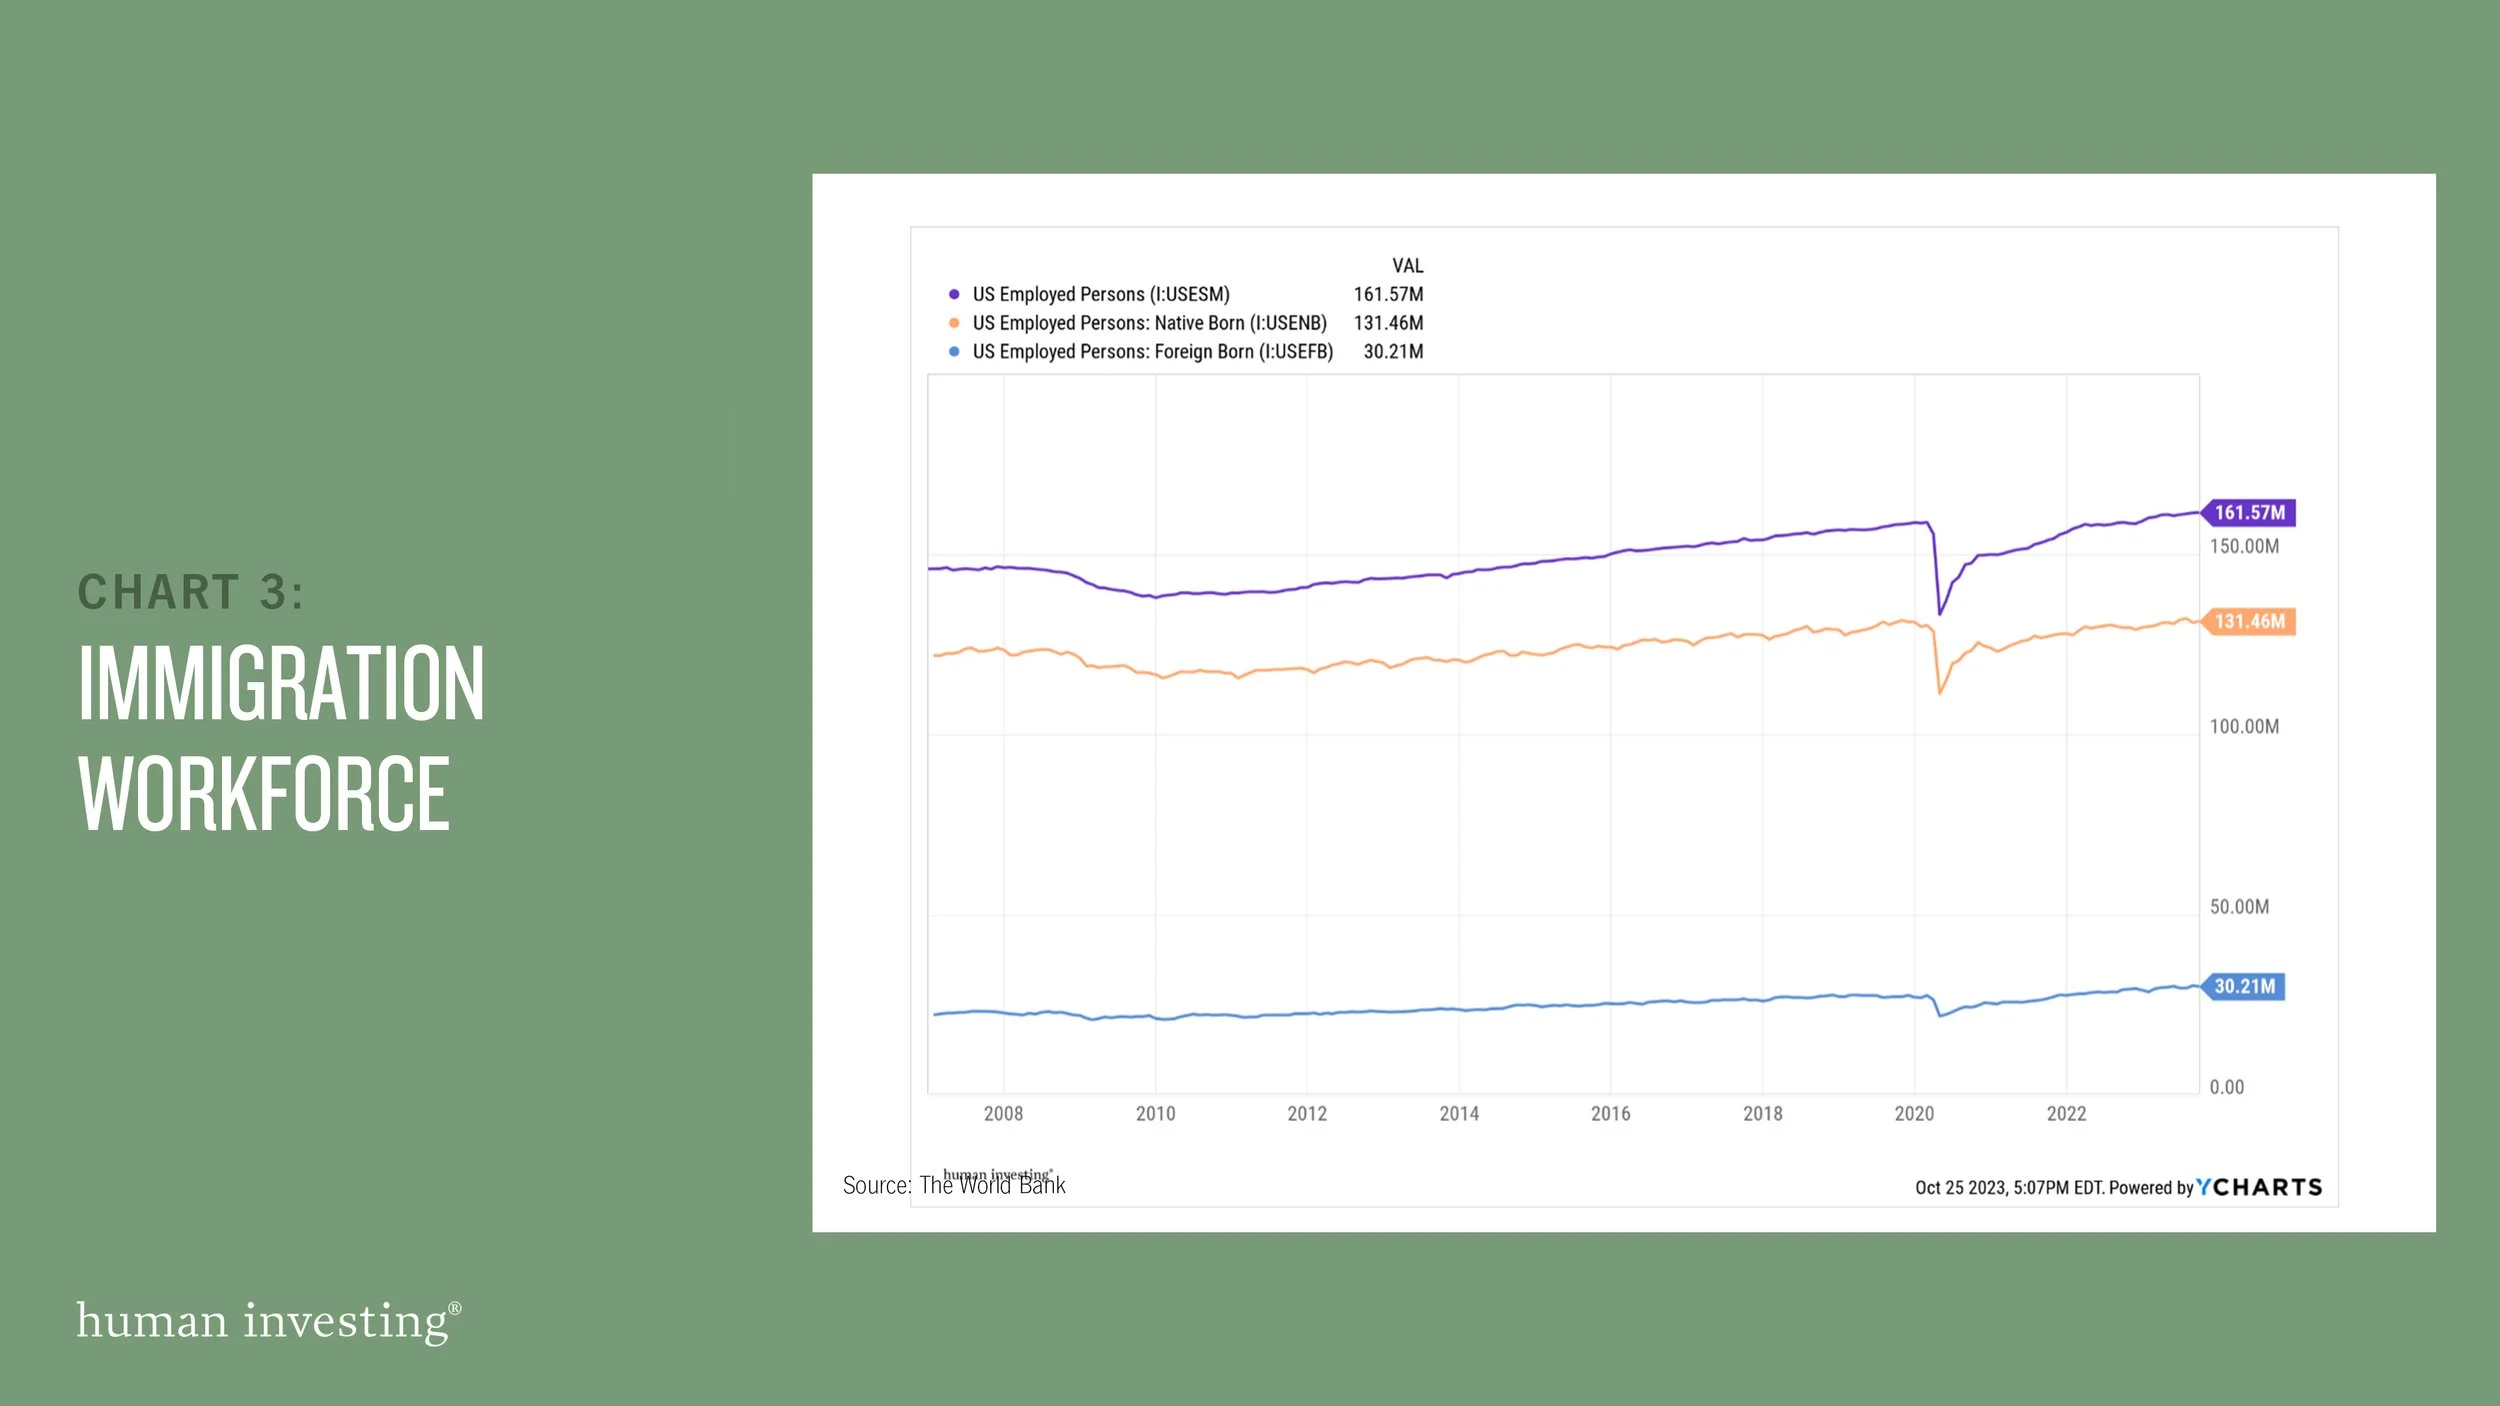
Gen Z is entering the workforce, but as a generation, they are too small to completely replace retiring baby boomers. Producing more working-age adults takes at least 16 years and 9 months, and the US birthrate has been below the stable replacement level of 2.1 for most of the last 50 years. If the US wants to sustain long-term population growth, and consequently, workforce expansion, it must either depend on immigration or find ways to boost the birth rate.

Implementing a policy permitting increased immigration could boost the size of the workforce in America. However, this is a politically contentious issue, and the legal framework around immigration is too uncertain to make reliable long-term predictions. Overly restrictive immigration policy could lead to a labor shortage, and too permissive immigration policy could cause a labor surplus. Foreign workers constitute approximately 20% of the US workforce.

A tighter labor market has some benefits for workers

The scarcity of labor translates into more choices when seeking employment and enhances the bargaining power of job seekers. Companies will have to consider their recruitment and retention policies to ensure they have the workers required for optimal performance. US wages and salaries are remaining above inflation, showing workers ability to demand higher compensation.

A tighter labor market plus higher wages could equal higher inflation rates

However, higher wages also entail increased costs for companies, and the allocation of these costs, whether to customers or shareholders, may result in higher inflation or reduced earnings. To counter inflation, the Federal Reserve has been increasing and maintaining higher interest rates. Many are apprehensive that the tight labor market (associated with demand-pull inflation) and ongoing post-COVID supply chain challenges (linked to cost-push inflation) could make achieving the long-term target of 2% inflation more challenging.

In Q3 2023 we observed inflation rates increasing from just below 3% in June to 3.7% in September. Many consider unemployment and inflation to have an inverse relationship. A tighter labor market may necessitate the Federal Reserve to persist with a more extended and aggressive tightening policy to manage inflation. If the Federal Reserve becomes overly aggressive in its tightening efforts, the concerns that led many to anticipate a 2023 recession could materialize.

All of this hinges on the tight labor market persisting. Technological advancements have the potential to enhance productivity to a level where a smaller workforce can achieve more and sustain economic growth. Modifications in immigration policy could either introduce a new source of workers or further reduce the size of the workforce.

In the long run, successful companies will adapt to the new environment and thrive. A diversified portfolio will continue to capture the growth of the companies that excel. We encourage investors to be prepared for a myriad of reasons to be nervous, and understand given time the market will figure things out and continue to grow.


Related Articles

2023 Q3 Economic Update: What’s behind the market rally


What recession?

As prognosticators assessed markets and the economy in the beginning of 2023, the expectation for many was a tumultuous year,  with a substantial likelihood of a recession. Now, nearly two-thirds of the way through the year, the S&P (Standard & Poor) 500 has surged by 18.73% through the end of August. Real GDP (Gross domestic product) has maintained steady growth, with quarterly increases of at least 2% since Q3 2022. Inflation, which began the year at a daunting 6.4%, has receded to 3.18%, still above The Fed's 2% long-term target but showing a marked improvement.

What changed given the gloomy expectations for 2023 at the start of the year? The biggest unknown was the impact of The Fed’s decision to continue raising interest rates. The expectation was that The Fed raising interest rates to cool inflation would cause an economic recession. We’ve even seen rising rates play a role in multiple banks failing earlier in 2023, but those events haven’t triggered any distress.

We’ll break down the top themes for why we’re seeing the markets and economy continue to power through.

Theme #1: Strong job market

Inflation has gone down, but GDP growth remains positive, and unemployment remains low. There are still 3 million more job openings than job seekers, and few were expecting The Fed to get this far on inflation without dipping the economy into a recession. Even experts have a difficult time accurately predicting where the markets and the economy are going.

Theme #2: ‘Soft landing’ of interest rate hikes

In contrast to the substantial interest rate hikes witnessed in 2022, the changes in 2023 have been modest. A significant contributor to the slowdown in interest rate hikes was the decline in inflation during the latter part of 2022, which has persisted into 2023. Consequently, The Fed didn’t need to enact as many rate increases, or do so as rapidly as they did in 2022.

Theme #3: Surprising growth from S&P 500 companies

The S&P 500’s rise has a couple of factors going for it. While 2022 saw a decline in earnings per share for S&P 500 companies, 2023 has witnessed earnings growth, with expectations that growth will continue. Analysts are feeling increasingly optimistic that companies will find a way to bolster earnings amidst a higher interest rate environment.

The other piece of the puzzle is the exceptional performance of the largest stocks within the S&P 500 this year. The S&P 500 is a market cap weighted index, meaning that each stock is weighted based on how large the company is. This means AAPL has a bigger weight than Home Depot, and AAPL being up 10% would increase the S&P 500 performance more than HD (Home Depot) being up 10%.

In 2023, returns have been concentrated in a few high-performing stocks. Put differently, only 28% of stocks in the S&P 500 have outperformed the index. This highlights the dominance of a handful of top performers in 2023. It’s worth noting 61% of stocks in the S&P 500 have achieved positive returns for the year, indicating favorable performance across the stock market.

Source: Data for this paragraph is based on using IVV (iShares Core S&P 500 ETF) holdings. Positions were all verified to be held 12/30/2022 and 8/24/2023 to ensure consistency of constituents. Average returns assumes equal weighting of the positions. Top 10 holdings are based on 8/24/2023 weighting: AAPL, MSFT, AMZN, NVDA, GOOGL, GOOG, META, BRK.B, TSLA, UNH. Jan-Aug performance data courtesy of YCharts as of 8/31/2023 market close.

Theme #4: Mid and small sized companies are not far behind

Many talk about the S&P 500 as though it represents the entire stock market. However the S&P 500 represents the largest companies in the US (typically $14.5 billion and greater), leaving out companies considered mid-sized and small.  The mid and small parts of the US markets have been lagging, still positive returns but not as high.

Source: All data courtesy of YCharts. Assumes S&P 500 for US Large, S&P 400 for Mid, S&P 600 for Small, and S&P 1500 for Total Market (blend for all). Uses Value & Growth versions of benchmarks respectively.

Predicting short-term MARKET outcomes continues to be difficult

Short-term value oriented investors may be frustrated to see their performance lagging the broad market. Alternatively, longer-term investors recall seeing a significant benefit in 2022 by experiencing less negative returns than the broad market or growth stocks. You are still positive from the start of 2022 to the end of August 2023. Growth and blend investors are still waiting to recover from the downturn. Trying to time when value or growth will outperform is not recommended. Find an investment style that suits your risk tolerance and financial plan, and be prepared to stick with it for the long haul despite periods of under or over performance.

The year 2023 so far serves as a compelling illustration of how stocks can still generate positive returns even in the face of grim expectations. It is also a great reminder of how difficult accurately predicting the economy or the markets is. The outlook for the equities market is rarely all sunshine and rainbows. Stock market volatility means that short-term corrections are always on the table. There are and always will be valid concerns that could lead to a downturn. If you are choosing a particular tilt in your investments, be prepared to stick with it over time. Long term, equities remain the best way to grow your savings. It is valuable to remember and reflect on the times when you anticipated poor returns but were pleasantly surprised by positive performance.


Related Articles

Economic Update From Human Investing: Yield Curves


What is the yield curve?

The yield curve refers to the current yields of US treasury bonds based upon time until maturity. It’s frequently depicted as a graph to help summarize the data. Typically, a yield curve is upward sloping. Short-term (ST) rates are lower, and long-term (LT) rates are higher.

Wall Street Journal, Bonds & Rates: Yield Curve, April 25, 2023

Reading the yield curve:

  • A “steeper” or “steepening” of the yield curve means short-term (ST) rates are lower, and long-term (LT) rates are higher, resulting in a steeper line when comparing

  • A “flatter” or “flattening” of the yield curve is when ST rates and LT rates are equivalent, or are getting closer to parity

  • An “inverted” yield curve is when ST rates are higher than LT rates, like the current line in the snapshot above.

What determines the yield curve?

All rates on the yield curve are determined by the market. The Fed only controls the federal funds rate, which is only the rate banks lend to each other overnight. Because the market determines the shape of the yield curve, many look to the yield curve as a summary of overall investor sentiment to draw conclusions about expectations for the future. Some important market factors that influence the yield curve include:

  • Liquidity (time horizon): The more time until a bond matures, the longer you have your money tied up. As a result, a longer time to maturity (and lower liquidity) bond tends to have a higher yield. This contributes to an upward sloping yield curve.

  • Growth expectations: If there are higher growth expectations, you tend to see a steeper yield curve. This is because higher growth tends to lead to higher inflation, and so rates must be higher to achieve positive real returns.

  • Demand: As more investors demand a bond, the price goes up. As bond prices go up, yields go down.

Why is the yield curve inverted, and why does that indicate a recession?

The yield curve is inverted because ST rates are higher than LT rates. This is largely due to The Fed raising interest rates to lower inflation. The Fed appears determined to reign in inflation, and has raised ST interest rates to slow down the economy enough to reduce inflation. This is putting upward pressure on ST rates. Many expect this approach to cause a recession, which would lower growth expectations, reducing LT interest rates. The result is the inverted yield curve we see today.

Why does this inversion indicate a recession?

In theory, the market is pricing treasuries so the returns over a given time period are the same, regardless of what you buy today. Let’s use an example to illustrate this.

Say you want to invest $10,000 in treasuries for 2 years, you can make two choices:

  1. Choice #1: Buy a single 2 year treasury

    • Currently a ~4.2% yield, so you earn roughly 4.2% for 2 years.

  2. Choice #2: Buy a 1 year treasury today, then a new 1 year treasury in 1 year:

    • Currently a ~4.7% yield, so you earn roughly 4.7% for 1 year.

    • After the first year, your treasury will mature, and you will have to purchase a new treasury at whatever the current rates are. The yield curve today is predicting 1 year rates will be at 3.7% in the following year.

    • Your overall return after averaging those rates for each year is 4.2% — the same as buying a 2 year treasury initially!

A lower rate in the future indicates lower growth expectations at that time. Growth expectations being lower (or negative) does not bode well for the health of the economy. The inverted yield curve also has a solid record of predicting recessions, but that doesn’t mean it’s perfect or guaranteed. The yield curve reflects the average sentiment of the markets, which indicates what expectations are. Sometimes expectations create a self-fulfilling prophecy situation, and sometimes expectations are flat out incorrect because of an unexpected shock, like the COVID-19 pandemic.

What does this mean for me and my portfolio?

Ultimately your portfolio should be allocated for the long term, and that should be positioned accordingly. While the inverted yield curve has been a strong predictor of recessions, the timing of that prediction and how significant it’s going to be are not consistent enough to provide an easy 5 step solution for everyone.

If you are positioned towards the more aggressive end of what you are comfortable with, consider reducing risk with some volatility expected on the horizon. Understand that regardless of the yield curve today, the long run expectation is growth and positive returns for the economy and equity markets.


Related Articles

Quarterly Economic Update from Human Investing
 

It’s a new year, and there are still plenty of old questions about the economy & markets. We thought diving into some questions about today’s economy would be helpful.

2023 Economic Outlook

Many different sources (See Table 1) forecast a recession for 2023. With The Fed combating inflation by raising interest rates, expectations are these moves will force the economy into a downturn. The extent of the recession may depend on The Fed’s actions. If inflation recedes quickly, and The Fed cuts rates or stops raising them, that could minimize a recession or possibly avoid a recession entirely—this is called a “soft landing.” If inflation persists, and The Fed is determined to lower inflation in the face of a declining economy, the recession could be worse. However, market forecasts expect The Fed to cut rates in 2023 in response to a recession. The Fed has yet to forecast those same rate cuts. Based on our observations, the odds are we will experience a mild recession in 2023.

2023 Investment Outlook

Despite the prospects of a recession, investments grow over the long run, and volatility is expected. As we’ve previously covered, it can take years for your portfolio to recover from a downturn. We have always seen markets recover to new all-time highs. With a looming recession, 10-year forecasts for US stocks remain positive.


Downturns present a buying opportunity for investors, particularly workers accumulating for retirement. Continuing to purchase when stocks decline is an excellent investment. Saving more when times are tough is challenging. Ensure you are in good financial shape: have 3-6 months of expenses saved in an emergency fund, pay off any high-interest debt, and consistently spend less than you make. Then consider increasing your savings. Increasing your contribution rate is a wonderful forced savings tool if you have a 401(k) or similar plan.
 
Markets and the Economy
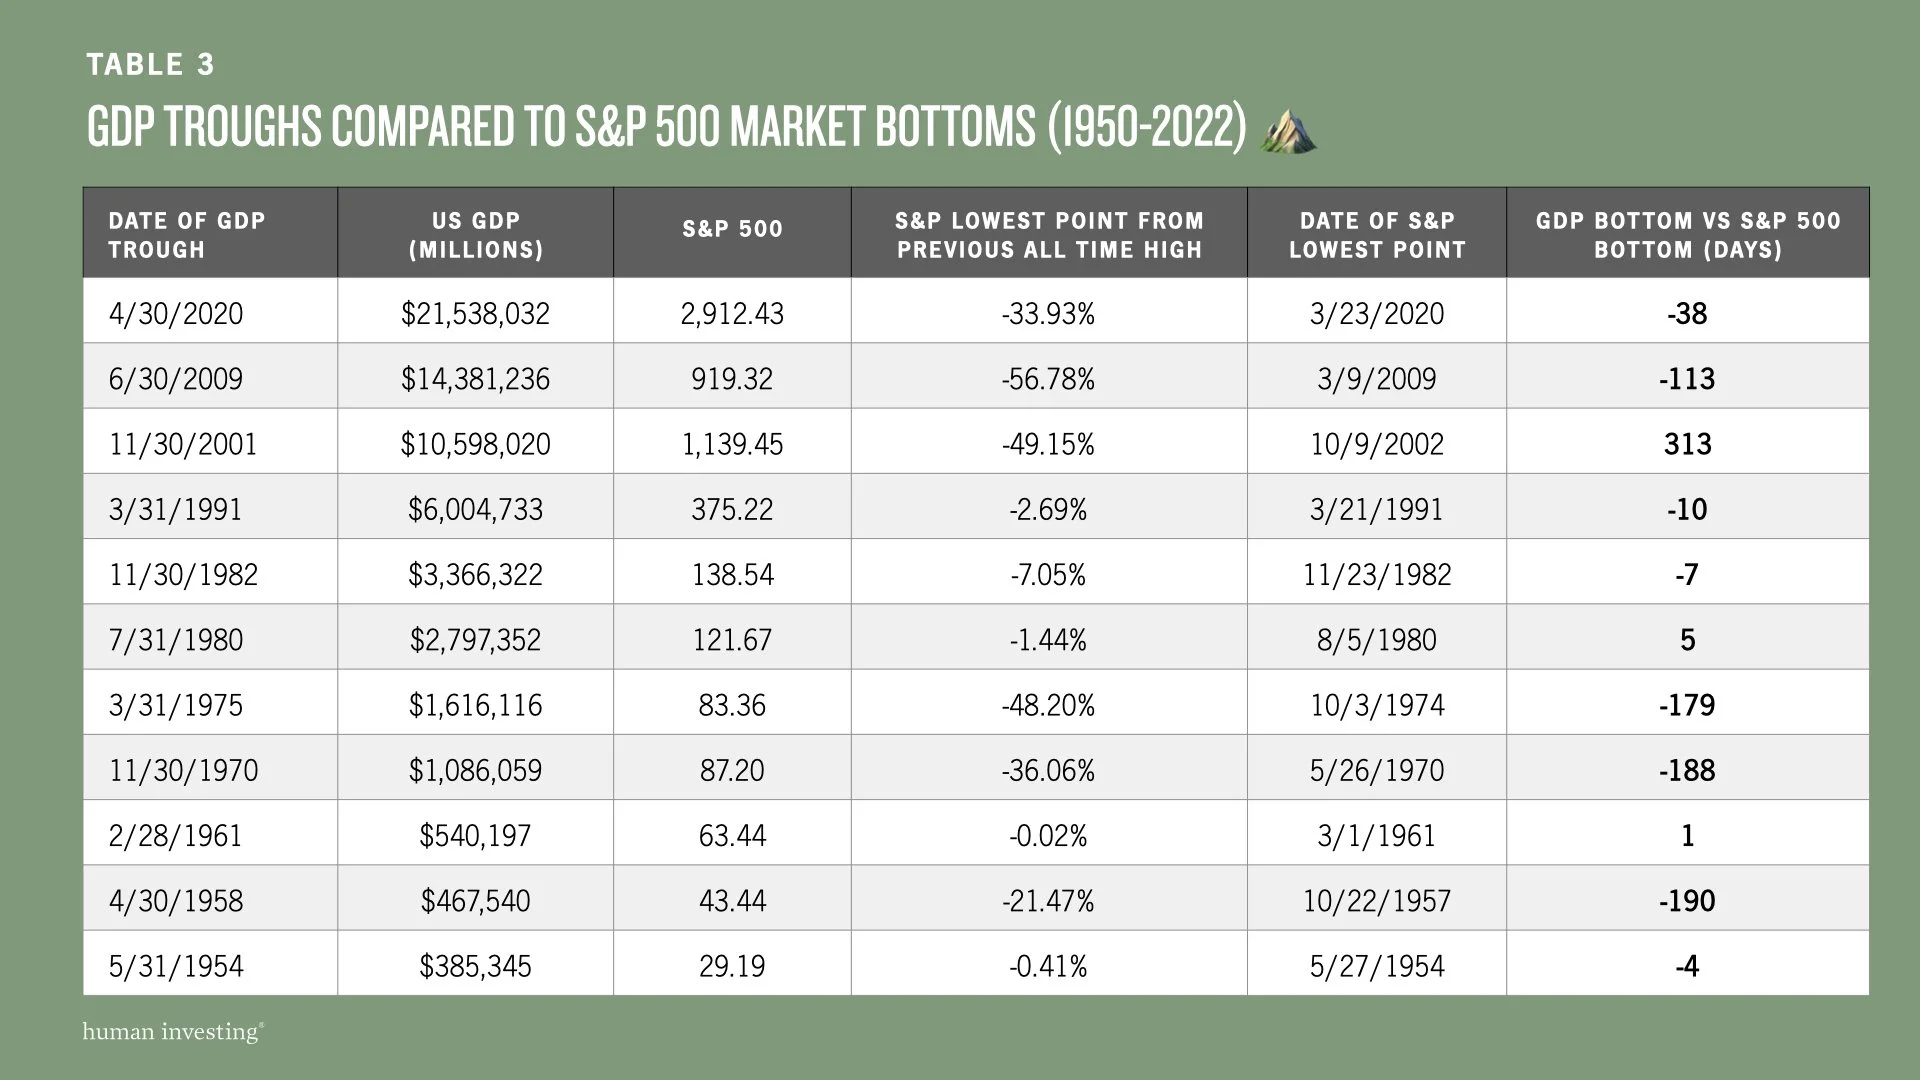
You may have heard the market is forward-looking. We know the market is a flawed prognosticator because prices still adjust daily to reflect new information. Let’s examine how closely market bottoms coincide with recessions.
 
There have been 11 recessions since 1950, according to the National Bureau of Economic Research (NBER). Using the NBER’s trough dates (i.e., the end of a recession), we can compare GDP with the S&P to see when both hit their lowest point. Looking at Table 3, the S&P 500 tends to do one of two things:

  1. The market is at its worst about the same time as the economy.

  2. The market is at its worst approximately six months before the economy bottoms out.


There are some caveats. Market data is live, and markets are open every business day. GDP data comes out quarterly, advance estimates come out nearly a month after the fact, and aren’t fully revised until around 60 days after initial release. For both the market and economy, knowing when you’ve hit bottom is nearly impossible to determine in the moment. Because it’s difficult to know when the worst is over, we recommend staying invested amidst the potential short-term tumult.

Be prepared for some turbulence this year

Economists and market prognosticators are expecting there will be a recession in 2023. The severity of the recession will vary depending on The Fed. The Unemployment rate remains below historical averages at 3.5%. In November 2022, there were nearly 6 million more job openings than job seekers, suggesting the economy can handle some tightening. Trying to time the market or economy bottom remains a guessing game. Long term, the outlook for returns is still strong. Be prepared for some turbulence this year, knowing you are headed in the right direction long term.

Sources
1. Federal Reserve Bank of New York. The yield curve as a leading indicator. January 2023.
2. The Wall Street Journal. Economists in WSJ survey still see recession this year despite easing inflation. January 2023.
3. Bloomberg. Economists place 70% chance for US recession in 2023. December 2022.
4. Vanguard. Vanguard economic and market outlook for 2023: Beating back inflation. December 2022.
5. BlackRock. 2023 global outlook. January 2023.
6. Charles Schwab. 2023 market outlook: Cross currents. January 2023.
7. Fidelity. Global outlook 2023: New world disorder. January 2023.
8. Charles Schwab. Schwab's 2023 long-term capital market expectations. January 2023.
9. Vanguard. Market perspectives: December 2022. November 2022.
10. BlackRock. Asset return expectations and uncertainty: as of September 2022 November 2022..
11. Data courtesy of YCharts & NBER


Related Articles