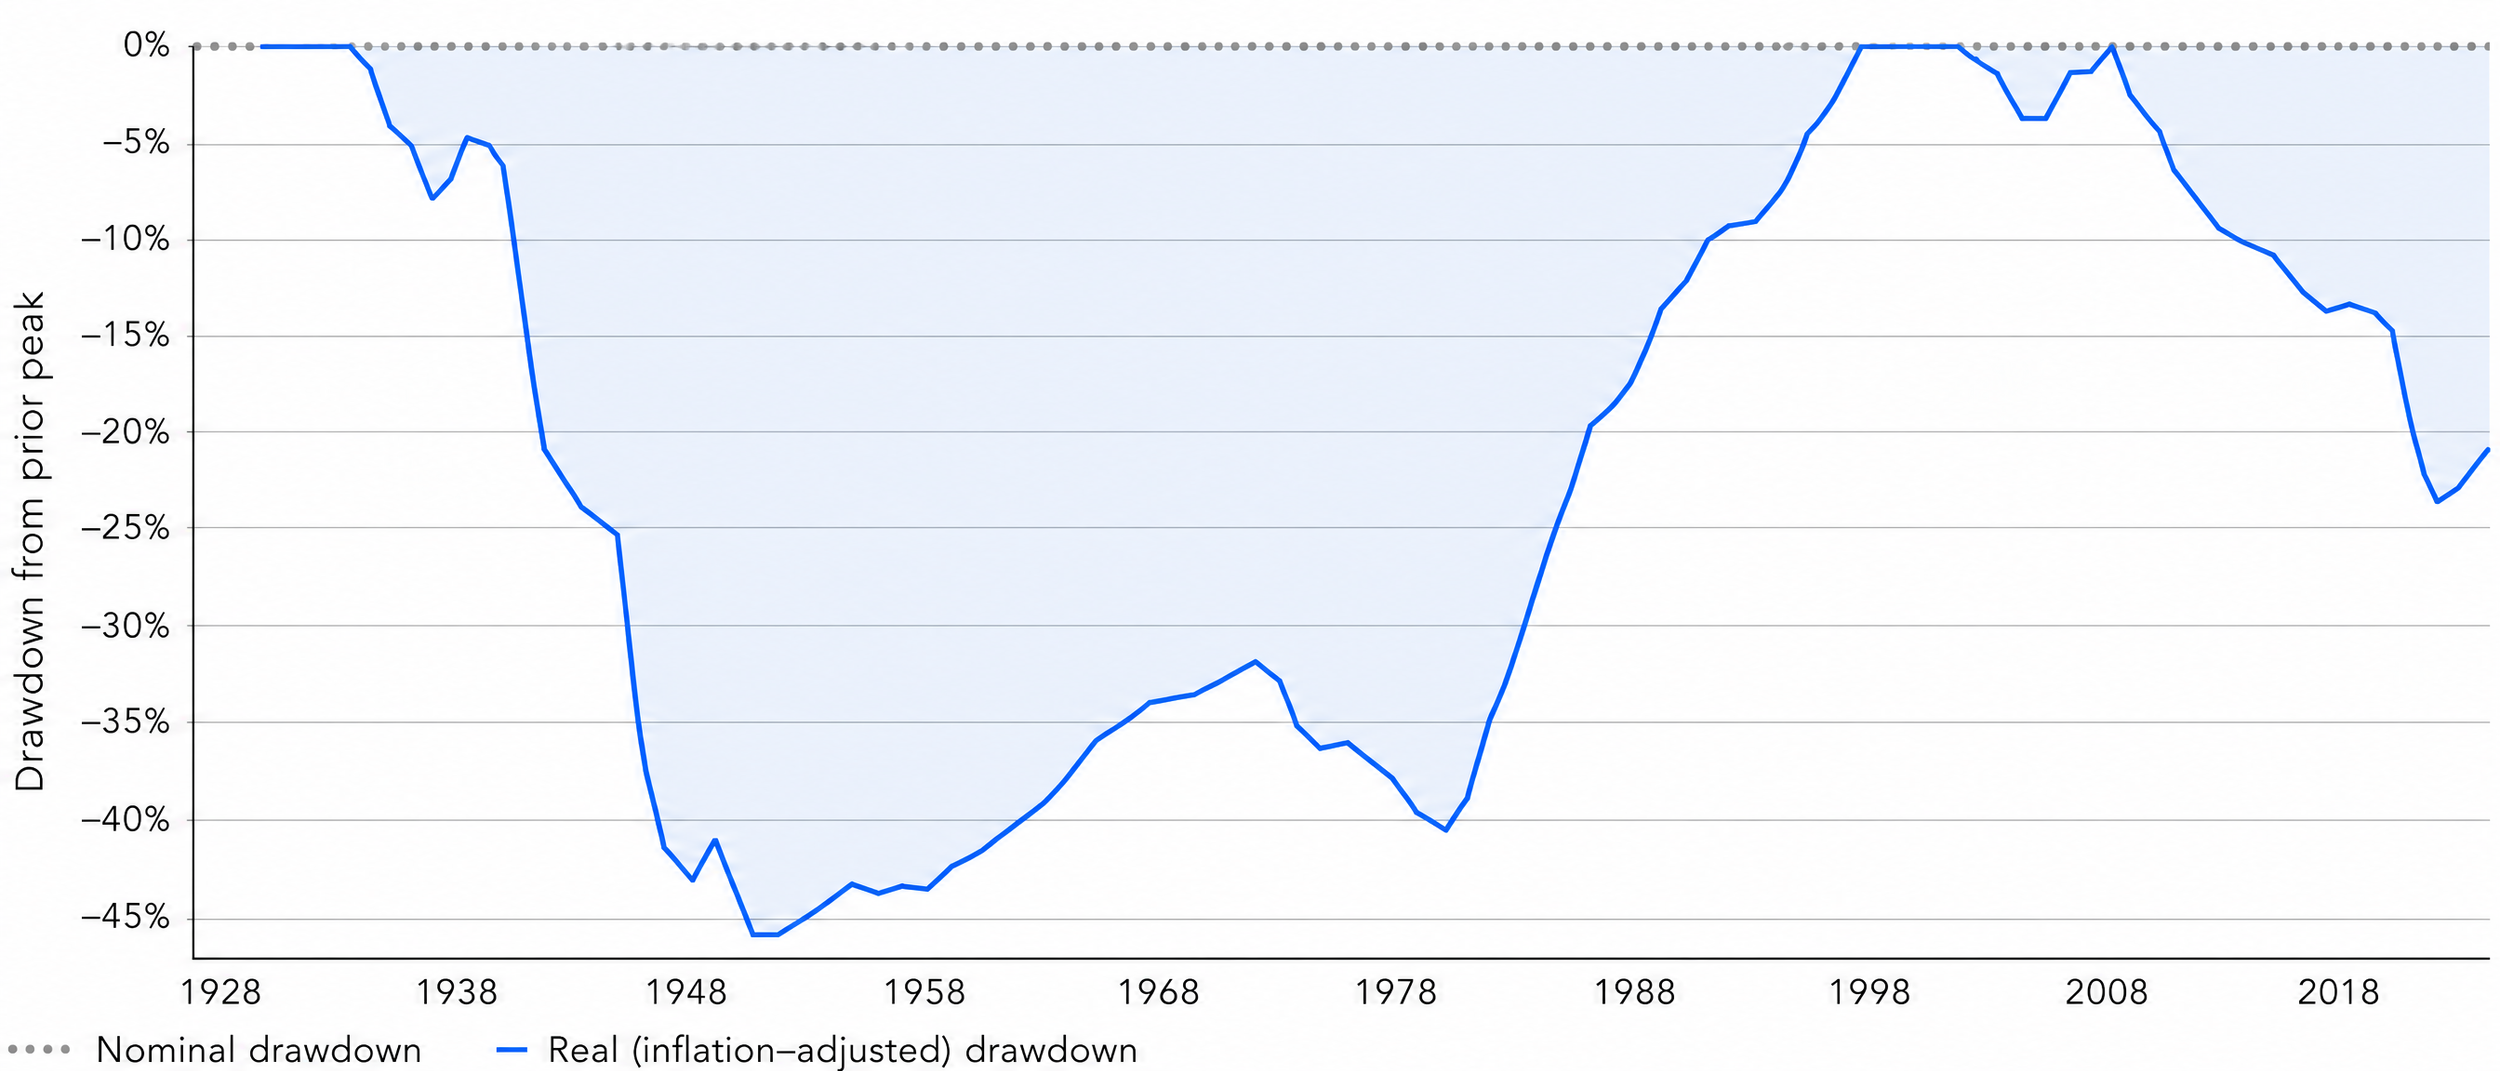

Hi Ground Episode 7: Gen-Z's Retirement Plan? Place Your Bets
 

E-mail us your questions, comments, and bad sports bet breaks: higroundpodcast@gmail.com

Episode 7 show notes

Part 1: Sports Betting Rush

  • Song, Zijia and Amponsah, Michelle. “Gen Z Is Moving Money From Stocks to Sports Betting in Wealth Plans” Bloomberg, 12 August 2026 [Article]

  • Bloomberg Originals. “Why Gen Z Is Gambling With Its Future” YouTube, uploaded by Bloomberg Originals, 10 July 2026 [Video]

  • Northwestern Mutual. “Planning & Progress Study 2026” Northwestern Mutual, 2026 [Report]


Part 2: Becoming a 401(k) Millionaire

  • Picchi, Aimee. “Sturdy stock market mints a record number of 401(k) millionaires” CBS News, 4 September 2026 [Article]

  • Fuhrmans, Vanessa. “American Workers Are Staying Put” Wall Street Journal, 9 September 2026 [Article]

  • Human Investing Retirement Contribution by Decade Calculator [Link]

  • Becoming a 401(K) Millionaire by Peter Fisher [Link]


Part 3: Local Recs

  • Swan Island Dahlias in Canby, OR [Link]

  • Hood to Coast Relay [Link]


Disclosure:
This material is provided for informational and educational purposes only. It should not be construed as investment, legal, or tax advice, nor does it constitute a recommendation or solicitation to buy or sell any security. Investors should consult with a qualified financial professional before making any investment decisions. Rebalancing and asset allocation strategies do not ensure a profit or protect against loss in declining markets. There is no guarantee that any investment strategy will achieve its objectives. Any references to historical performance, academic studies, or research are based on past data and should not be considered indicative of future results. Past performance is not a guarantee of future outcomes. Advisory services offered through Human Investing, an SEC-registered investment adviser.


Related Articles

Should I sell my Nike stock now or wait?


Earnings season is coming

Nike’s stock price has been struggling, for several years now. You have to go back to the early 2000s to find a time when it took Nike longer to hit a new all time high. With that, many Nike employees are wondering what to do with their stock. Whether it is to diversify into another investment or to fund expenses like vacation, remodels, or tuition for their kids, the current price has made those decisions more difficult. A common question we hear is “Should I sell my NKE now or wait?”

NKE has recently experienced declines. From Jan 2025 to Apr 2026, NKE fell -41.60% while the S&P 500 has risen 22.57%. Nike had a great run of outperforming the S&P 500 for 10 out of 12 years prior to 2021 but has been on a losing streak since.

Is Nike poised to make a comeback? Predicting the future of any stock, or the market overall, is a difficult task. Nike is the industry leader in athletic apparel, particularly in footwear. If Nike can maintain their brand and industry leadership, they are poised to be successful. Achieving outperformance relative to the S&P 500 is not guaranteed.

Let’s look at a few different ways to approach valuing a stock to get a sense of if NKE appears over or undervalued.

🍰 Price / Earnings (P/E) ratio - how much are you paying for each dollar of earnings:

  • Pros: Earnings are the profits of the company, and those profits are ultimately what is available for shareholders as dividends

  • Cons: Easily manipulated or adjusted by many line items on the income statement, can vary greatly year to year

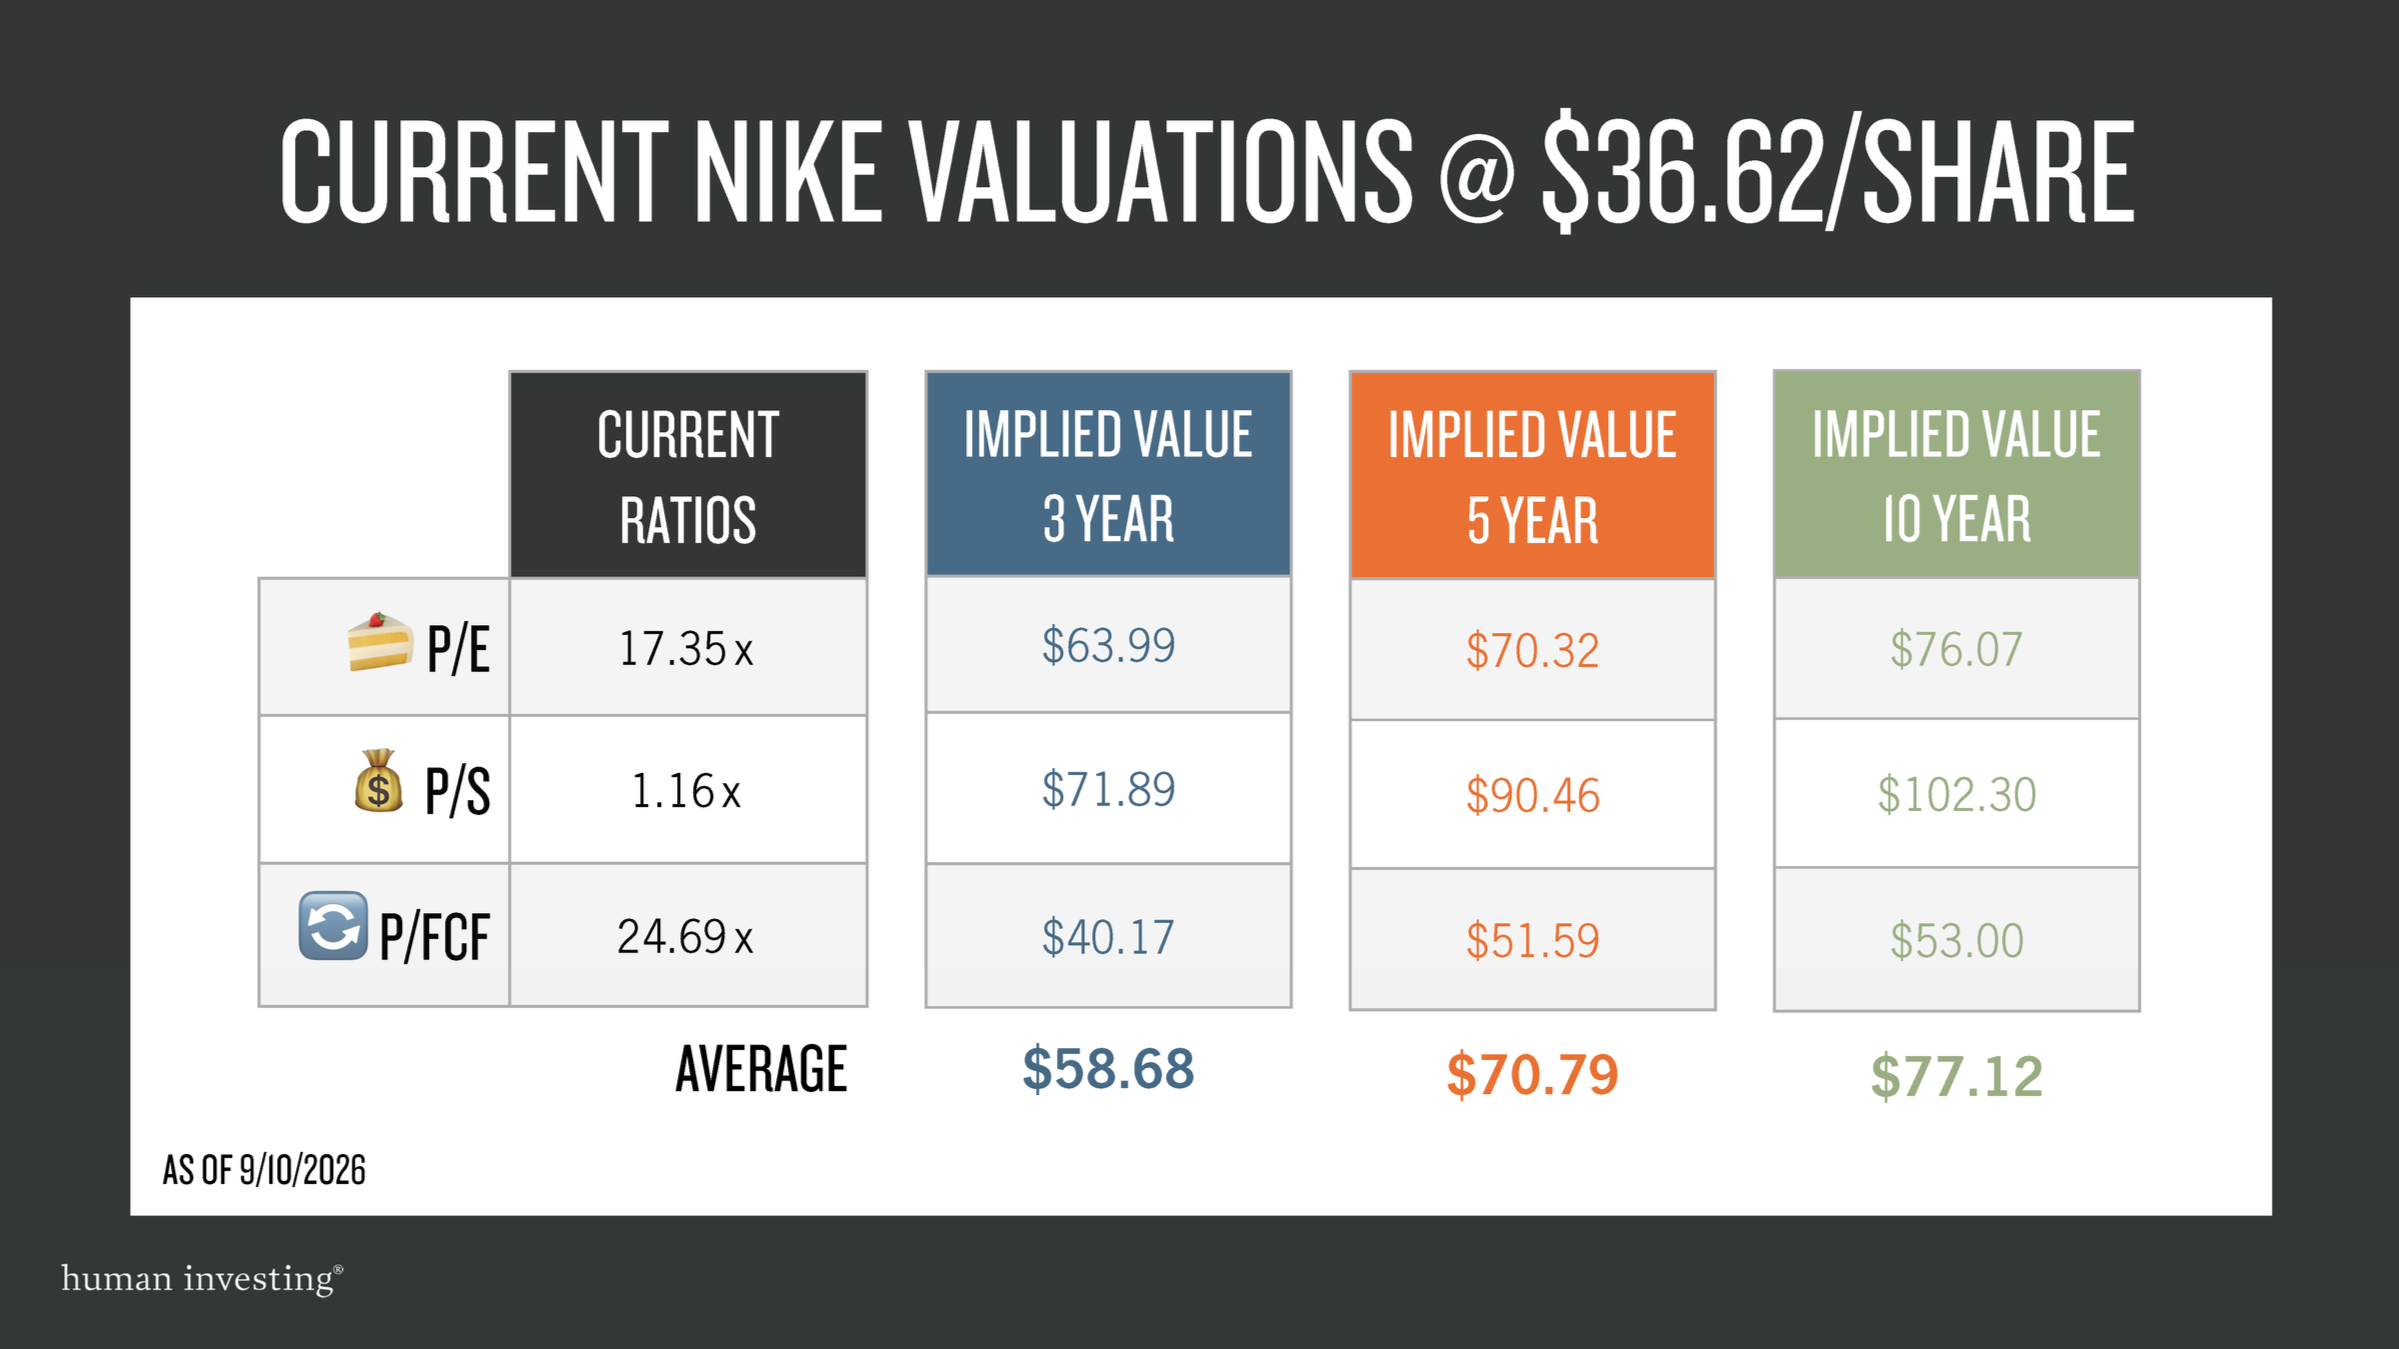
  • Current P/E: 17.35

  • 3 year median P/E: 27.85

  • Implied Valuation based on $2.30 Earnings Per Share = $63.99

  • Verdict: Based on this metric, NKE appears below its historical median valuation.

💰 Price / Sales (P/S) ratio – how much are you paying for each dollar of revenue:

  • Pros: Less subject to manipulation or fluctuation

  • Cons: Doesn’t consider efficiency (i.e. costs necessary to generate the revenues)

  • Current P/S: 1.16

  • 3 year median P/S: 2.3

  • Implied Value based on $31.26 revenue per share = $71.89

  • Verdict: Based on this metric, NKE appears below its historical median valuation.

🔄 Price / Free Cash Flow (P/FCF) ratio - How much are you paying for each dollar of operating cash:

  • Pros: Shows cash actually available to investors for dividends or stock buybacks, ignores non-cash expenses (i.e. depreciation)

  • Cons: Still subject to manipulation based on accounting practices, can vary greatly year to year

  • Current P/FCF: 24.69

  • 3 year median P/FCF: 27.24

  • Implied value based on $1.48 free cash flow per share = $40.17

  • Verdict: Based on this metric, NKE appears below its historical median valuation.

🥣 Average of all ratios:

  • Take the average of the implied values for P/E, P/S, and P/FCF

  • Implied Value = $58.68

  • Verdict: Based on this metric, NKE appears below its historical median valuation.

🚀 Price / Earnings Growth (PEG) ratio = P/E ratio / Earning Growth – measure P/E in context of company’s growth rate

  • If PEG > 1, your stock is expensive; if PEG is <1, your stock is cheap.

  • Currently: 17.35 / 5.21 = 3.33

  • Forward 1 year: 3.52

  • Verdict: The current stock price of NKE is expensive, relative to recent earnings.

Based on historical averages, NKE currently appears undervalued

That is typical for a stock that has been declining in earnings and price over time.You can also take different time periods for the median of these valuations, to see what Nike’s valuation has been like over a longer period of time.

Note: All data courtesy of YCharts as of:  9/10/2026

While Nike may appear undervalued on a 3-year basis, the difference is greater over 5-year and 10-year medians. If you’re thinking about selling, these valuations may give you some guideline thresholds to re-evaluate at.

Based on historical averages for NKE, the stock currently appears undervalued. The decline in NKE’s price in recent years is a big reason for that. Whether the decline will continue, or NKE will return to its historical valuation norms nobody knows.

However the PEG ratio shows that the stock appears overvalued, meaning investors are paying a higher price for the stock relative to its expected earnings growth. Looking at the basic fundamentals, NKE has had some clear struggles. 2026 fiscal year results were flat from 2025, which means they maintained their business level. On the other end, the basics of continuing on as a business seem strong for NKE:

  • NKE has consistently sold its products above the cost of those goods.

  • NKE can cover both its current and longer-term debt needs based on existing cash and future expected earnings.

  • NKE has not missed a dividend in the past 10 years.

These metrics are by no means the only way to approach whether now is a good time to sell your NKE stock. Other factors to consider:

  • The amount of time you think you will work at Nike.

  • How much of your Net Worth is tied to NKE?

  • When do your Stock Options expire (if applicable)?

  • Your comfort level with the ups and downs over time.

  • Do you have any major expenses coming up? i.e. house purchase, funding college, etc.

We’re here to help

Beyond these factors and metrics, it is important to integrate your Nike stock decisions within the context of a comprehensive financial plan. If you have questions or would like to discuss whether to hold or sell your NKE stock, please reach out to us at nike@humaninvesting.com.


Disclosure: This material is for informational and educational purposes only and should not be considered personalized tax, legal, or investment advice. You should consult your own qualified tax, legal, and financial professionals before making any decisions based on this information. Tax laws and regulations, including those related to bonuses and supplemental income, are subject to change and may vary depending on individual circumstances. The examples provided are hypothetical and intended to illustrate general tax concepts; they should not be relied upon to determine your actual tax liability. Investing and financial planning involve risk, including the possible loss of principal. Past performance does not guarantee future results. Advisory services are offered through Human Investing, LLC, an SEC-registered investment adviser.


Related Articles

Hi Ground Episode 6: Time to Nerd Out. Bonds Are Having A Moment
 

E-mail us your questions, comments, and if you have a blue polo too: higroundpodcast@gmail.com

Episode 6 show notes

Part 1: Why Are Bonds Acting Up?

  • Goldfarb, Sam and Rubin, Richard. “Bonds Are Getting Hammered, and Wall Street Says the Rout Won’t End Anytime Soon” Wall Street Journal, 18 August 2026 [Article]

Part 2: Where Do Bonds Fit?

  • Kellar, Will. “Managing Your Finances With The Three Bucket Approach” Human Investing Journal, 10 June 2025 [Article]


Part 3: Parking ‘Safe’ Dollars

  • Gottfried, Miriam. “Wealth Management Has a $3 Trillion Problem: Investors Are Keeping Too Much Cash” Wall Street Journal, 12 August 2026 [Article]

 
  • Damodaran, Aswath. “Historical Returns on Stocks, Bonds, Real Estate and Gold.” Stern School of Business at New York University. 1 August 2026. [Database]

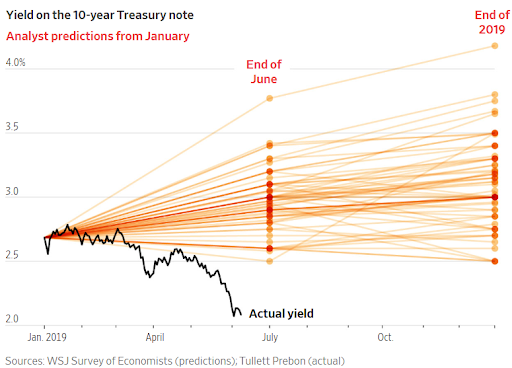
  • Chilkoti, Avantika and Kruger, Daniel. “Some Investors Had Hunch Yields Were About to Fall” Wall Street Journall, 9 June 2019 [Article]


Part 4: Local Recs

  • Portland Annual Swift Watch [Link]

  • LPGA The Standard Classic [Link]


Disclosure:
This material is provided for informational and educational purposes only. It should not be construed as investment, legal, or tax advice, nor does it constitute a recommendation or solicitation to buy or sell any security. Investors should consult with a qualified financial professional before making any investment decisions. Rebalancing and asset allocation strategies do not ensure a profit or protect against loss in declining markets. There is no guarantee that any investment strategy will achieve its objectives. Any references to historical performance, academic studies, or research are based on past data and should not be considered indicative of future results. Past performance is not a guarantee of future outcomes. Advisory services offered through Human Investing, an SEC-registered investment adviser.


Related Articles

Ballpark Your Retirement Readiness With Our Simple Calculator


Being a financial advisor means friends and family feel comfortable asking you their most personal money questions. A friend pulled me aside at coffee last week with a question we hear all the time: How do you know when you can actually afford to retire?

This friend is single and in her 60s. She works part-time and has some savings and investments but feels uncertain about the future. How does anyone plan for the coming years, she wondered, when end-of-life costs are impossible to guess? How do we know how much we’ll be spending, or even where we’ll be living?

This situation is one of the most common reasons people hire us as financial advisors; we can analyze your exact circumstances and model how different choices will impact your finances over time.

But for inquiring minds at the coffee shop, here’s how you can ballpark your readiness.

Retirement Readiness Quick(ish) Calculation:

Give it a try below. Keep reading on for the full breakdown of each step.

Retirement Readiness Calculator
Human Investing

Retirement Readiness Calculator

A ballpark estimate based on your income, savings, and spending. Not a substitute for a financial plan.

Step 1
Include housing, utilities, groceries, insurance, dining, travel, and incidentals.
Step 2
Find your estimated benefit at ssa.gov. Enter 0 if not applicable.
Step 3
Pension, annuity, rental income, or part-time work. Use gross income before taxes.
Step 4
Every dollar in IRAs, 401(k)s, 403(b)s, brokerage accounts. Exclude your emergency fund.

Investment income (4% rule / 12)
Social Security
Other income
Total monthly income
Estimated monthly spending
Monthly surplus / shortfall

This calculator uses a 4% annual withdrawal rate as a starting estimate. Your actual withdrawal rate may differ based on your timeline, tax situation, and plan. This is not financial advice.

  1. Estimate your current monthly spending. Include fixed expenses like your rent/mortgage, utilities, insurance, and groceries, as well as incidentals like shopping, restaurants, and vacations. If you know your mortgage will be paid off or you anticipate specific changes, like increased healthcare or vacation spending, you should adjust your estimate.

  2. Determine your Social Security benefit. Go to ssa.gov and look up your monthly benefit amount in the year you plan to retire or, if you know it, the year you will begin taking your benefit. (These years don’t need to be the same.) While there’s no universal best age to start taking your benefit, doing so later will translate into a larger monthly check.

  3. Add other reliable income to determine your total monthly inflow. Think pension, annuity, rental income, or a part-time job. (Use your gross income before taxes or deductions.)

  4. Add investment income:
    a. First, tally up your total invested assets. That means every dollar in an IRA, 401(k), 403(b), IAP, brokerage, or other investment or retirement account. Don’t include your emergency fund.
    b. Then, calculate your monthly withdrawals. Assume a withdrawal rate of 4%, a common starting place. Multiply your total invested assets by .04, then divide by 12. Example with $500,000 invested: $500,000 x 0.04 = $20,000. $20,000 / 12 = $1,666.67 monthly income from investments.

  5. Determine your total income. Add together your Social Security benefit, other income, and investment income.

  6. Calculate your potential shortfall. Subtract your total monthly spending from your total income. This amount is the shortfall you’ll need to cover your estimated expenses in retirement, hopefully with investment account withdrawals. Example: With a monthly spend of $5,000, a $1,200 monthly pension, and a Social Security benefit of $3,000, your total income is $4,200. Your shortfall is therefore $800, or $5,000 minus $4,200.

Nailing Down the Details

Ultimately, your retirement plan must consider what happens during a prolonged market decline, when to claim Social Security, healthcare costs, taxes, and many other factors.

The calculation above is a first step that can tell you whether retirement appears to be within reach and, perhaps more importantly, which questions deserve a closer look before you make the decision, such as:

  • Will my mortgage be paid off before I retire?

  • When should I take Social Security?

  • What are my priorities for spending, saving, and gifting?

A financial advisor can hone your retirement spending projection, factor in major expenses like a home upgrade after retirement, and account for family medical history. We also help people understand what an appropriate withdrawal rate might be. (We’ve used 4% in the calculation above, but this percentage is only a general rule.)

Critically, an advisor can guide you through the foundational decision of when to take Social Security if you’re eligible. This decision impacts nearly every aspect of retirement planning.

What if I Don’t Have Enough?

Any amount you can save for retirement is helpful. Clients who reach their 80s with $40,000 saved have a cushion that can protect against unexpected expenses, and people with $100,000 may be able to pay for a year or more of assisted living. Mindset matters, too. People who throw up their hands in mid-life and don’t save for retirement because they run into a challenging health problem or unexpected layoff tend to be worse off than those who can recognize bad times are often temporary, and pick up saving what they can, when they can.

We work with a wide range of clients, from those who retire early to those who start thinking about retirement much later in life. Our commitment to meaningfully help people at all asset levels is one of the reasons that I work at Human Investing. Regardless of your financial circumstances, the same advice applies: Stay flexible in your mindset about money. Do what you can, forgive yourself for past missteps, and seize new opportunities as they arise.


Disclosure: Human Investing is an SEC-registered investment adviser. Registration does not imply a certain level of skill or training. This content is for informational and educational purposes only and does not constitute personalized investment advice or a recommendation. Past performance is not indicative of future results. All investments carry risk, including potential loss of principal. Readers should consult with a qualified professional regarding their specific financial situation.


 

Related Articles

Hi Ground Episode 5: The Economy, Staying Balanced, and Hot Dogs?
 

E-mail us your questions, comments, and hot dog stories: higroundpodcast@gmail.com

Episode 5 show notes

Part 1: The Economy vs. Stock Market

  • Heard on the Streets Staff. “Markets Rally on Surprise U.S. Job Losses” Wall Street Journal, 7 August 2026 [Article]

  • Mutikani, Lucia. “US suffers unexpected job losses in July, markets dial back rate hike expectations” Reuters, 7 August 2026 [Article]

  • Michael Burry 2023 “Sell” [Link]

  • Chart: S&P 500 % Change Over Previous 5-years


Part 2: $100 Hot Dogs & Investing Behavior

  • Chandler, Adam. “The Rise of the $100 Hot Dog” Wall Street Journal, 8 August 2026 [Article]

  • Lake, Sydney. “Costco CEO promises the $1.50 hot dog isn’t going away: The price will not change as long as I’m around” Fortune, 4 July 2026 [Article]

  • Understanding ERISA Diversification [Link]

  • “The Real Cost of Your Morning Coffee” Human Investing, 22 May 2015 [Article]

Part 3: Local Recs

  • Hot Mama Salsa Tortilla Chips [Link]

  • Farmer Johns Produce & Nursery, McMinnville OR [Link]


Disclosure:
This material is provided for informational and educational purposes only. It should not be construed as investment, legal, or tax advice, nor does it constitute a recommendation or solicitation to buy or sell any security. Investors should consult with a qualified financial professional before making any investment decisions. Rebalancing and asset allocation strategies do not ensure a profit or protect against loss in declining markets. There is no guarantee that any investment strategy will achieve its objectives. Any references to historical performance, academic studies, or research are based on past data and should not be considered indicative of future results. Past performance is not a guarantee of future outcomes. Advisory services offered through Human Investing, an SEC-registered investment adviser.


Related Articles

Quarterly Economic Update: The Market Beneath the Market
 

If you had told me at the beginning of the year that the seven largest companies would underperform, inflation would remain stubborn, tariffs would add pressure to prices, another interest-rate hike would become a real possibility, and conflict would disrupt shipping through the Strait of Hormuz, I would have guessed the stock market would be down. 

That would have been a reasonable guess….it also would have been wrong. 

Through July, the S&P 500 has gained roughly 10% including dividends, despite an economic backdrop that seemed to hint otherwise. It’s a reminder that the future rarely unfolds exactly as we think it will. Markets have a way of surprising both optimists and pessimists.  

That brings us to one of the more interesting stories unfolding beneath the surface this year. 

A Different Kind of Market 

For the past several years, the story of the U.S. stock market was largely the story of seven companies: NVIDIA, Apple, Microsoft, Amazon, Alphabet, Meta, and Tesla. Together, they are often referred to as the “Magnificent Seven,” or simply the “Mag 7.” 

In 2023, the Magnificent Seven gained approximately 76%, while the remaining 493 companies in the S&P 500 returned roughly 11%. In 2024, the Mag 7 gained another 48%, compared with approximately 14% for the rest of the index. 

Compounded over those two years, the Magnificent Seven appreciated roughly 160%, while the remaining 493 companies of the S&P 500 gained about 27%.

These returns were supported by business success. The companies delivered impressive earnings, benefited from the excitement surrounding artificial intelligence, and established themselves as leaders in some of the world’s most important industries. As a result, this relatively small group accounted for a significant share of the market’s gains.  

This year, something important has changed. The market has continued to move higher, but this time the gains have come from a much wider range of companies. Smaller companies generally have outperformed large companies, and international markets have outperformed large companies in the US. 

The market has continued to move forward, but it hasn’t needed the same seven companies to carry it. 

Why Broader Participation Matters 

A market supported by more companies is generally healthier than one carried by only a handful of names. Broader participation means the market is less dependent on the ongoing success of the same companies. 

One of the interesting realities of investing is that a great business doesn't always make a great investment. A company can continue growing while its stock underperforms simply because expectations have already become so high. 

The Magnificent Seven did not suddenly become seven bad businesses. They entered the year carrying high expectations, large positions within the index, and several years of extraordinary performance. Meanwhile, many other parts of the market entered the year with lower valuations and less enthusiasm. 

As investors began finding opportunities elsewhere, market leadership broadened. This shift is a normal part of how markets work. 

J.P. Morgan’s historical review of the ten largest companies in the S&P 500 shows how market leadership has changed across decades. The companies dominating the index in 1985 looked very different from those leading in 2005, 2015, or 2025. Some remained successful businesses for decades. Very few remained the market’s dominant investment leaders.   

The lesson is not that today’s largest companies are destined to fail. History simply gives us little reason to assume that the same group will lead forever. 

Seasons like this are where diversification proves its value 

When large technology companies lead the market for several years, it can begin to feel as though they are the only investments that matter. International stocks, smaller companies, and other parts of the market may receive far less attention. Then leadership quickly changes, often when few investors expect it. 

Diversification acknowledges that none of us knows exactly how the future will unfold. Rather than trying to predict the next winning sector, company, or country, it allows investors to participate in market growth as a whole. The result is a portfolio that is less dependent on any single outcome and better prepared for a range of possible futures. 

The Portfolio Serves the Plan

One of the reasons we spend so much time building a financial plan before building an investment portfolio is because the plan defines what success actually looks like. 

The portfolio then becomes a tool to support that plan. Its purpose may be: 

  • To fund retirement. 

  • To provide confidence that spending can continue through changing markets. 

  • To create flexibility for opportunities that arise unexpectedly. 

  • To support children and grandchildren. 

  • To give generously. 

  • To weather setbacks without having to abandon long-term goals. 

When a portfolio is anchored to a thoughtful financial plan, it becomes easier to stomach periods of change. There is less need to chase whatever happens to be performing best because the portfolio was never built around a single prediction in the first place. 

Instead, we ask a different question: Does this portfolio continue to provide a high probability of accomplishing the goals that matter most? 

That perspective doesn't eliminate uncertainty. It simply helps us respond to uncertainty with patience rather than reaction. 

Built for Uncertainty

None of this means the risks have disappeared. Markets will almost certainly face new challenges that we cannot anticipate today, and periods of volatility are inevitable. 

But this year has offered an important reminder: the market often does its best work while investors are focused on reasons it shouldn't. 

While leadership changes, narratives change, and headlines change, the importance of your goals does not. 

That is why we continue to believe in thoughtful financial planning, broad diversification, tax-wise investing, and the discipline to stay focused on what matters most. 

The objective has never been to predict every twist in the market. It is to build a financial plan and portfolio that can succeed through many different kinds of markets. 

At the beginning of the year, many investors would have predicted a very different outcome than the one we've experienced. 

We cannot know which companies, sectors, or countries will lead next… fortunately, we do not have to.


Disclosure:
This material is provided for informational and educational purposes only. It should not be construed as investment, legal, or tax advice, nor does it constitute a recommendation or solicitation to buy or sell any security. Investors should consult with a qualified financial professional before making any investment decisions. Rebalancing and asset allocation strategies do not ensure a profit or protect against loss in declining markets. There is no guarantee that any investment strategy will achieve its objectives. Any references to historical performance, academic studies, or research are based on past data and should not be considered indicative of future results. Past performance is not a guarantee of future outcomes. Advisory services offered through Human Investing, an SEC-registered investment adviser.


Related Articles

Hi Ground Episode 4: The Chase, The Crash, & Investing Sirens
 

E-mail us your questions, comments, and investing sirens: higroundpodcast@gmail.com

Episode 4 show notes

Part 1: The Allure of the Gamble

  • “'I couldn't breathe': South Korea's frenzied stock trading exposes margin loan risks.” Reuters, 19 July 2026 [Article]

  • The Frame by Samsung [Link]

  • Thaler, Richard. Johnson, Eric. “Gambling With the House Money and Trying to Break Even: The Effects of Prior Outcomes on Risky Choice.” Research Gate, June 1990 [Article]

  • Chart: What percentage gain is needed to make up for a loss?


Part 2: The Odyssey Sirens

Part 3: Rip City Update

  • “Tom Dundon using a tired playbook.” Bald Faced Truth by John Canzano, 25 July 2026 [Article]

  • “Trail Blazers, city of Portland finally meet, but distance to arena deal remains ‘significant’.” The Athletic, 30 July 2026 [Article]

  • 4.14.2004: Kobe Bryant Nails the Winning 3 in Double OT [Video]

Part 4: Local Gems

  • Call Ja Morant Hotline [Link]

  • Suttle Lodge Boat House, Deschutes National Forest, Oregon [Link]


Disclosure:
This material is provided for informational and educational purposes only. It should not be construed as investment, legal, or tax advice, nor does it constitute a recommendation or solicitation to buy or sell any security. Investors should consult with a qualified financial professional before making any investment decisions. Rebalancing and asset allocation strategies do not ensure a profit or protect against loss in declining markets. There is no guarantee that any investment strategy will achieve its objectives. Any references to historical performance, academic studies, or research are based on past data and should not be considered indicative of future results. Past performance is not a guarantee of future outcomes. Advisory services offered through Human Investing, an SEC-registered investment adviser.


Related Articles

Hi Ground Episode 3: 2026 Halftime Report: Stock Market, Oregon Real Estate & Risk


Disclosure:
This material is provided for informational and educational purposes only. It should not be construed as investment, legal, or tax advice, nor does it constitute a recommendation or solicitation to buy or sell any security. Investors should consult with a qualified financial professional before making any investment decisions. Rebalancing and asset allocation strategies do not ensure a profit or protect against loss in declining markets. There is no guarantee that any investment strategy will achieve its objectives. Any references to historical performance, academic studies, or research are based on past data and should not be considered indicative of future results. Past performance is not a guarantee of future outcomes. Advisory services offered through Human Investing, an SEC-registered investment adviser.


Related Articles

RSUs vs. Stock Options: How Nike Employees Should Think About This Year’s $NKE Stock Choice


Every year, Nike employees face a decision that feels deceptively simple: RSUs or stock options? For many, it's easy to default to what you chose last year, or to let the current NKE share price drive the decision. But the right answer looks different depending on where you are in your financial life.

What You're Actually Deciding

During the stock choice window, Nike employees choose how to receive a portion of their equity compensation. You can elect to receive:

  • RSUs (Restricted Stock Units): A set number of shares that vest over time. You know what you're getting, and when.

  • Stock Options: The right to purchase NKE shares at a set price in the future. If the stock rises above that price, you benefit. If it doesn't, the options may expire worthless.

  • Half of each: A combination of the two, at 50% RSUs and 50% stock options.

What's Happening With NKE Right Now

It's hard to ignore the share price. As of publishing, NKE is sitting at $42.77, down 32% year to date. Over the last five years, NKE has dropped significantly, and if you've been watching, you may be wondering whether now is actually a good time to load up on options while the price is low.

That instinct is understandable. But it's worth separating the stock choice decision from a market prediction. Even great companies can face extended periods of underperformance. Tariffs, supply chain disruptions, changing consumer preferences: Nike has navigated all of these recently, and nobody predicted the depth of the decline.

While recent share price performance has been challenging, opinions about Nike's long-term outlook remain mixed. Some investors believe operational improvements could support future growth and build internal momentum, while others remain cautious given broader economic conditions such as broader investor buy-in. Ultimately, future stock performance is uncertain.

Rather than trying to predict where Nike's stock price will go next, the more important question is whether your financial plan is designed to accommodate the level of risk you're comfortable taking.

Three Scenarios: Which One Sounds Like You?

Every situation is different. We profiled three common employee stock choice scenarios in this piece if you want to see how others in similar situations have thought through it. Otherwise, here's a quick framework to find yourself:

You might choose 100% Stock Options if:

  • You don't anticipate needing cash in the next few years

  • You believe NKE will recover and increase over time

  • You're comfortable with the possibility of walking away with nothing if it doesn't

  • You already have strong cash flow and financial stability outside of your equity compensation

You might choose 100% RSUs if:

  • You need a reliable source of income or liquidity in the near future

  • You prefer certainty over upside potential

  • You consider yourself a more risk-averse investor

You might choose a 50/50 split if:

  • You want some certainty but aren't ready to walk away from potential upside

  • Your financial plan is in good shape, but you want to hedge both directions

  • You find yourself genuinely torn between the two

You Might Already Own More Nike Than You Think

Whichever you choose, it's worth stepping back and looking at your total NKE exposure. Between your stock choice, prior RSU vests, ESPP participation, and any shares you've held onto, Nike may already represent a significant portion of your net worth.

That's not necessarily a problem, but it's worth knowing. We believe successful long-term investing should be diversified, low-cost, and unglamorous. Some might call it boring. If you want to maintain some Nike exposure without feeling overly concentrated, many large-cap index funds already hold NKE as a position. You get to participate in the upside in a more measured way.

Your Next Step

The best way to get a concrete answer to what you should select for your stock choice this year is to review this decision in conjunction with your comprehensive financial plan. Cash flow, upcoming expenses, existing NKE exposure, risk tolerance — all of it factors in.

 If you’re still asking yourself, should I choose stock options this year or are unsure where to go next, we’d be happy to help you make your decision.


Disclosure: Human Investing is an SEC-registered investment adviser. Registration does not imply a certain level of skill or training. This content is for informational and educational purposes only and does not constitute personalized investment advice or a recommendation. Past performance is not indicative of future results. All investments carry risk, including potential loss of principal. Readers should consult with a qualified professional regarding their specific financial situation. The examples discussed above are hypothetical and are intended solely for educational purposes. Individual circumstances will vary.

 

Related Articles

Hi Ground Episode 2: Why is my paycheck disappearing so fast?


Disclosure:
This material is provided for informational and educational purposes only. It should not be construed as investment, legal, or tax advice, nor does it constitute a recommendation or solicitation to buy or sell any security. Investors should consult with a qualified financial professional before making any investment decisions. Rebalancing and asset allocation strategies do not ensure a profit or protect against loss in declining markets. There is no guarantee that any investment strategy will achieve its objectives. Any references to historical performance, academic studies, or research are based on past data and should not be considered indicative of future results. Past performance is not a guarantee of future outcomes. Advisory services offered through Human Investing, an SEC-registered investment adviser.


Related Articles

Pay Off Debt or Save for the Future? Why the Answer Is Both


Recently, our office had a fun, lively debate, centered around the question: “What is the opposite of fire?” Answers varied from ice, water, not fire, etc. This question inevitably raised another question – What does it mean to be an “opposite?”

Personal finance has a version of this problem: paying down debt versus saving for the future are routinely framed as opposites.

Each of us has our own beliefs around money. Some of this has been shaped by our family of origin, how we were raised, or by our lived experiences as adults. My family of origin always emphasized debt as something to be eliminated at all costs and as aggressively as possible.  Personal finance experts like the one-and-only Dave Ramsey would agree.

Wanting debt paid off as soon as possible is a very human instinct. A client recently told me “We’ve been putting extra money towards paying off our mortgage. It just feels good to see the balance go down.” Debt can feel heavy and limiting. As another client once succinctly shared, “Loans make me sad.” And with Americans now carrying more household debt than at any point in history, that weight is only growing.

But in personal finance, sometimes doing what feels responsible can actually cost you.

Debt Paydown Is a Form of Saving

Recent Vanguard research asserts that “paying down debt is a form of savings, just like saving for an emergency fund or retirement.” They aren’t opposite. In recognizing this, we can now reframe our decision making and give each of our dollars a specific job.

Rather than thinking in separate and distinct categories such as paying off debt, saving for emergencies, or saving for retirement, you can simply ask “Where is my next dollar most effective?” Some of our previous blogs have broadly explored this idea, but I’d like to get specific.

Two Debt Mistakes That Hurt Long-Term Wealth

My Grandpa Leo would say, “All debt is bad,” and maybe you feel similarly. However you feel about debt, the fact is not all debt is created equal, and debt differs in amounts, interest rates, terms, etc. Your payoff strategy and financial plan should reflect these details and nuances.

Although debt differs, Vanguard outlines two patterns that show up consistently regarding debt that generate a negative impact in someone’s lifetime net worth:

  1. Paying Down High-Interest Debt Too Slowly

  2. Paying Down Low-Interest Debt Too Quickly

The patterns are counterintuitive: most people are simultaneously moving too slow on the debt that hurts them the most long-term, and too fast on debt that isn't. Getting the sequence right can meaningfully change your financial outcome over time.

Before we go further, a quick frame of reference. When we refer to 'high-interest debt,' we mean anything with an interest rate at 7% or higher. That number comes from the historical long-term return of a diversified investment portfolio. If your debt costs more than your investments are likely to earn, paying it down first wins. We'll use this as a benchmark throughout. Actual returns over time may vary.

Let’s explore each debt paydown mistake together.

Mistake #1: Paying Down High-Interest Debt Too Slowly

About 35% of investors carry revolving credit card debt — balances that roll month to month and compound at high interest rates. What Vanguard found is that many of these same households have money sitting in savings earning underwhelming returns, are making additional unnecessary payments on lower-interest loans, and are over-contributing to their 401(k) beyond the employer match.

In other words, they have the resources to wipe out their most expensive debt. They're just directing those dollars somewhere else.

This is rarely intentional, and it's more common than you'd think (see chart below). It's what happens when financial decisions get made in isolation. Each one feels reasonable on its own (paying down a loan, building up savings, maxing out your retirement), but without a coordinated strategy, those dollars aren't working together. They're working against each other.

Mistake #2: Paying Down Low Interest Debt Too Quickly

Many people make aggressive payments on mortgages, student loans, and auto loans — debts with interest rates below 7%. While your intention may be good, the math doesn’t always support it.

What Vanguard found is that many of these same households are leaving employer 401(k) matching contributions on the table, investing less than they could, and drawing down cash reserves.

The cost of that tradeoff is real. For a worker earning a median income of $81,000, prepaying a low-interest debt for 10 years while missing out on the full employer match could mean an estimated $120,000 less at retirement. That's not a rounding error.

As the chart below shows, decisions that feel productive in one area can quietly limit your progress in another.

Why Emotion Drives Most Debt Decisions

Financial decisions are not just about math. Behavioral and emotional components have a strong influence in our decision making. I would argue this isn’t necessarily a bad thing. It’s a human thing.

The emotional pull of debt shows up in conversations constantly. Clients say things like:

“I just want to get rid of all my debt as quickly as possible.”
“I can’t invest until I am totally debt-free.”
“My student loans bother me more because the balance is bigger. I want to tackle those instead of the tiny balance on my credit card.”

These feelings are valid but they can lead to decisions that don't reflect the full picture, like ignoring a high-interest credit card because the balance feels manageable.

Your history with money shapes how you make these decisions. Being honest about that is actually the first step toward a better strategy. Instead of applying a single rule, the goal is sequencing. Knowing which dollar goes where, and in what order, makes the whole system work.

How to Sequence Your Debt Paydown

Here are the starting points, drawn from Vanguard's research:

1. Prioritize your 401(k) employer match before paying down debt.

This is my favorite financial move with a guaranteed return, typically 50–100% on your contributions. If you're not capturing the full match, you're leaving money on the table. This takes priority even before paying down high-interest debt, because no debt payoff strategy outperforms free money.

Pay off debt or save for the future?

Invest it or pay off the loan?

$10,000 over 30 years — investing at 7% vs. a 4% loan balance

Invested @ 7% annualized 4% loan balance if unpaid
The gap at year 30: $43,689. When your investment return rate (7%) meaningfully exceeds your loan rate (4%), putting extra dollars to work in the market outpaces what you save by paying off debt early. Risk tolerance and peace of mind matter too — but the math favors investing.

2. Pay off high-interest debt (7% or higher) aggressively.

Credit card balances and similar debts compound quickly and quietly. Once eliminated, those payments free up real cash for investing, saving, or whatever comes next.

If this step feels out of reach, you're not alone. Nonprofits like GreenPath Financial Wellness can help you pay down consumer debt, lower your interest rates, and access free financial counseling.

Pay off debt or save for the future?

The price of ignoring high-interest debt

$10,000 over 30 years — three scenarios compared

Invested @ 7% annualized Pay off 4% loan Carry 20% debt (unpaid)

3. Weigh investing against paying down low-interest debt.

Once you've captured your match and cleared high-interest debt, the next question is whether extra dollars are better used paying down a low-interest loan or going toward long-term investing. Money invested in your 401(k) or Roth IRA is likely to outperform the cost of that debt over time. It might not feel as satisfying in the short term but the math tends to win.

A Better Way to Think About Debt

These steps don't exist in isolation. A debt paydown strategy is one piece of a personalized financial plan. When your debt, savings, and investing decisions are coordinated, your dollars work harder and your progress compounds over time. And not to mention, it feels much better.

Want to chat through your prioritization of a dollar, or how to approach your debt paydown strategy?  Let’s connect!


Disclosure: Human Investing is an SEC-registered investment adviser. Registration does not imply a certain level of skill or training. This content is for informational and educational purposes only and does not constitute personalized investment advice or a recommendation. Past performance is not indicative of future results. All investments carry risk, including potential loss of principal. Readers should consult with a qualified professional regarding their specific financial situation.


Related Articles

Hi Ground Episode 1: Is SpaceX Actually Going To Do Well?


Disclosure:
This material is provided for informational and educational purposes only. It should not be construed as investment, legal, or tax advice, nor does it constitute a recommendation or solicitation to buy or sell any security. Investors should consult with a qualified financial professional before making any investment decisions. Rebalancing and asset allocation strategies do not ensure a profit or protect against loss in declining markets. There is no guarantee that any investment strategy will achieve its objectives. Any references to historical performance, academic studies, or research are based on past data and should not be considered indicative of future results. Past performance is not a guarantee of future outcomes. Advisory services offered through Human Investing, an SEC-registered investment adviser.


Related Articles