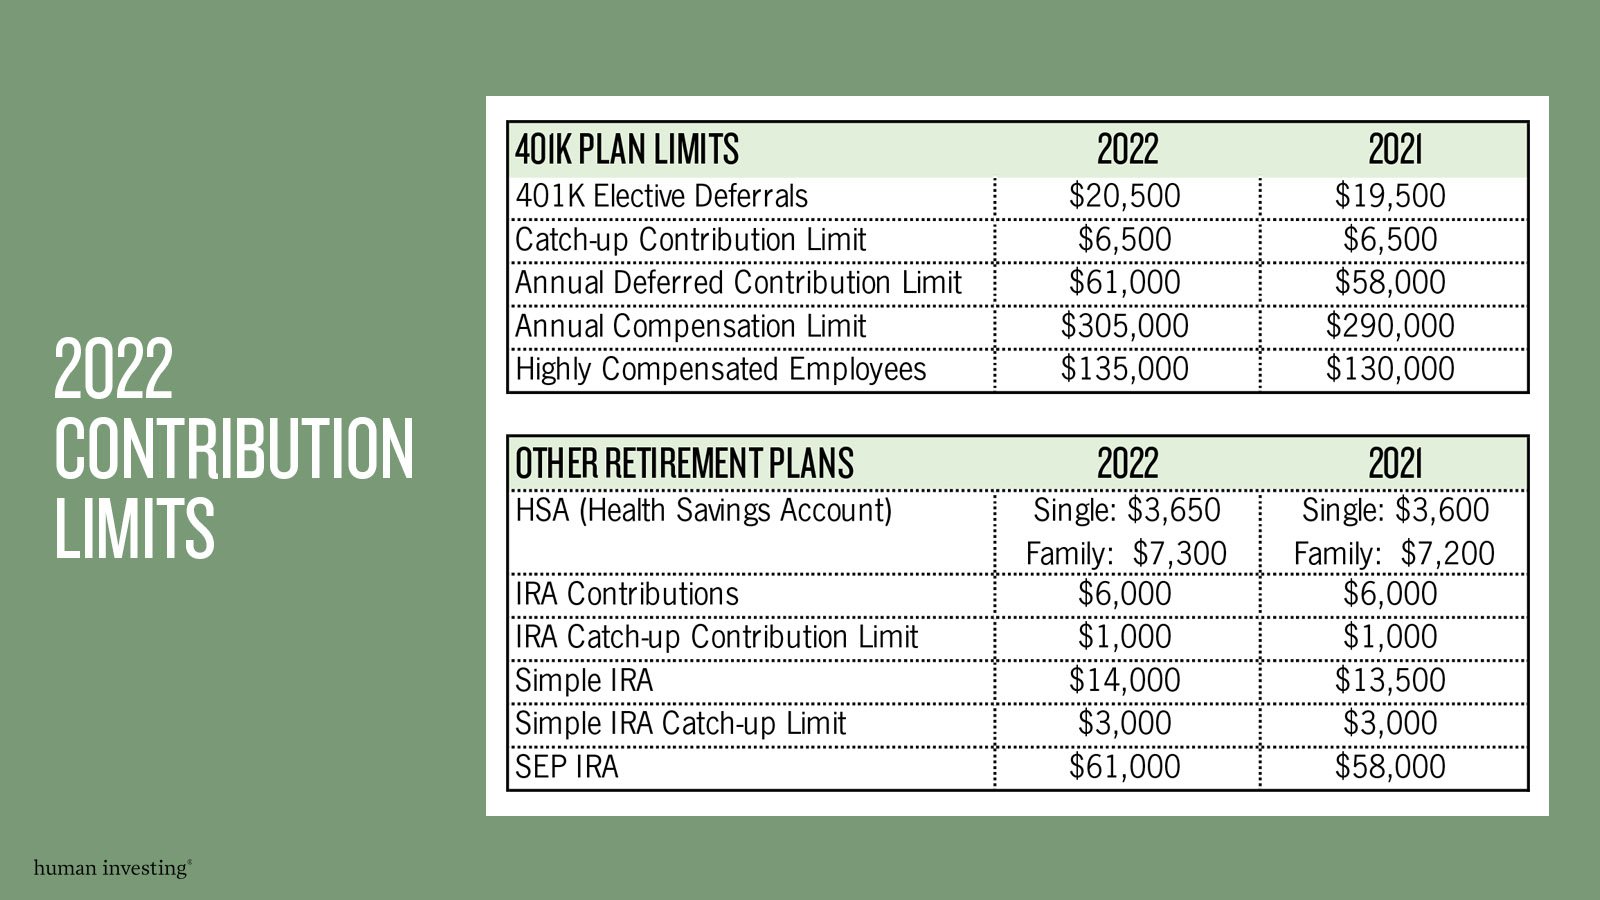
The IRS Has Increased Contribution Limits for 2022
 

There is good news for retirement accounts! The IRS has increased the contribution limits for the upcoming year. As you can see below, an important change for 2022 is that 401(k) elective deferrals increased from $19,500 to $20,500. That’s not all! Please see below for the applicable updates for the coming year:

How do these changes impact your savings in the upcoming year? Are there any changes you should be making? Use this link to schedule a time to meet one-on-one with our team. We look forward to working with you in 2022!


Related Articles

Charts of Q3 2021
 

Welcome to fall! Before we race to the pumpkin patch, let’s look back on July, August and September. We selected 5 different visuals from the past quarter to share with you.

1: The S&P 500 Reaches an All-time High

On September 2, 2021, the S&P 500 closed at an all-time high (see chart). While this is a record-breaking statistic, the S&P 500 has also experienced more than 50 all-time highs in 2021. Prior to this year, there are only six other calendar years with at least 50 record closes (2017, 2014, and 1995 are the most recent years).

As a result of these market highs, we have noticed heightened concerns about a looming market crash. Because what goes up, must come down?? The two most common concerns we hear are:

  1. “I know the market is at an all-time high. I want to sell my investments today and reinvest these dollars when the market crashes in the coming months”. See chart 2 for our typical response.

  2. “I know the market is going to crash. I want to move all my money into something safe like cash or bonds. What do you think I should do?”

If you are someone that is worrying about your investments (maybe it’s something entirely different from the two concerns listed above), please reach out to our team so we can listen to your concerns and build an investment strategy for you going forward. To be frank, the timeline for spending 401(k) dollars impacts the advice we give. For example, we would give different advice to someone planning to spend their 401(k) savings soon than to someone in their mid-forties with no intentions of spending their 401(k) soon.

2: What About This Looming Market Crash?

If you have setup a 401(k) account, then you are investing your dollars every single pay period. This phenomenon is called dollar-cost averaging and it works really well for most retirement accounts. If you have a 401(k) account, we recommend leaning into dollar-cost averaging, setting up annual account rebalancing, and assessing your account strategy periodically. Of course, this strategy is not one-size-fits-all. Some investors prefer to intervene with their investments if they are predicting an upcoming market crash.

That being said, we recently found this article by Nick Maggiulli that compares gradually investing a consistent dollar amount (like per paycheck 401(k) contributions) to saving dollars up to buy a market dip. Please take the time to read the whole article, but if you want the cliff notes here you are:

  • The article points out that stockpiling cash in anticipation of a market crash is an unlikely strategy to win out in the long run.

  • Trying to buy the dip usually fails because large dips are rare. As a result, the strategy turns into stockpiling cash which is not a good idea for the long-term.

  • If you do want to try and buy the dip, think about getting your cash invested in the stock market as soon as possible.

For some help interpreting this chart, here is the text directly from Nick Maggulii’s blog post. “This chart shows that there is roughly a one in four chance of beating DCA when using a Buy the Dip strategy with a 10%-20% dip threshold. If you were to use a 50% dip threshold, the chance of outperforming DCA increases to nearly 40%. But this doesn’t come without a cost. Because while you are more likely to outperform DCA when using a bigger dip threshold, you also underperform by more (on average) as well.”

3: Monthly Child Tax Payments

July 2021 was the beginning of the monthly child tax credit payment for parents. Did you see our 20-minute webinar about the child tax credit, why it matters, and some financial planning considerations for parents?

Flash-forward a few months, and we have found a study of 1,514 American parents who received the monthly child tax credit payments. As you can see, most parents have saved their payments for emergencies which is a disciplined usage of the excess cash.

4: Vanguard Announces Lower Fees for Target Retirement Funds

In late August, Vanguard announced they are lowering the expense ratio (the cost) of their target-date funds by February 2022. We believe this is good news for all investors using Vanguard target retirement funds!

Vanguard will lower the expense ratio to 8 basis points meanwhile they are committed to maintaining the same glidepath methodology and asset allocation.

To articulate the cost savings, we assembled a table showing the potential impact for someone invested in a Vanguard target retirement fund with the updated expense ratio. For someone with $100,000 in a Vanguard target retirement fund, this lowered expense ratio means immediate annual savings. Just to be clear, the $90 vs $80 are annual fees which add up to be meaningful cost savings for you over a long period of time. Cheers!

5: Be Careful who you Get Advice From

How many self-proclaimed market savants are sharing their opinions with the world? So many! Be careful who you listen to. We couldn’t help but include some humor in this post. Feel free to relish in the ridiculousness of this chart.

That concludes our Charts of Q3 2021 post. We will be assembling the next Charts of the Quarter post before we know it. Take care! — Your Human Investing Team


signature-HI Team-401k-2021 copy.png
 

Related Articles

S&P Stock Market Performance and Capital Gains Tax Increases
 
wall st.jpg

Many of our blog articles are inspired by conversations we have throughout the week. This article on the S&P 500 stock market performance and capital gains tax increases is no exception. The question we are being asked is, "what do you think is going to happen with the market if capital gains go up?" Our recent response has been, "let us do some research and circle back to you." Here is what we found:

  1. Federal capital gains tax rates are currently near 70-year lows

  2. The proposed bill (House Ways & Means Committee, September 13, 2021) increases the top capital gains rate from 20% to 25% on income above $400,000.

  3. The previously proposed rate was 39.6% but kicked in at $1,000,000 of income.

  4. Table 1 below provides a side-by-side of the recent proposal with current capital gains rates and income brackets.

capital-gains-01-table.jpg

With this background on where rates have been and what is being proposed, we look to address the question, "so what happens to the market when capital gains rates go up?" Table 2 below tells an interesting story. Although there is market anxiety leading up to the proposed capital gain tax change, which results in a negative average return, the six months following the tax increase, the market is favorable. Wait, what? Excuse me for a minute while I reexamine Table 2. Ok, yes, the market is actually up after a proposed tax increase on capital gains.

capital-gains-02-table.jpg

As we have learned from our 25 years advising clients, anything is possible, and history does not always repeat itself. Another lesson learned from experience is that the market does not care about our charts, nor does it give a rip about our attempt to explain what might be. It is nice to know that cap gains tax hikes do not always mean turbulent markets are ahead. In fact, the market has performed above the historical average when a cap gain tax hike is put in place—at least, that is the case for the six months following the increase.


Related Articles

Dr. Peter Fisher
The Real Risk of Owning Bonds: Too Much in Bonds May Hurt Your Purchasing Power
 

We talk to a lot of different people about investing. A common request is something along the lines of: “I don’t want to lose anything, and I want my money to grow.” This is a challenging, if not impossible mission. The investment world is full of opportunities to grow your money. However, there is an inherent risk when you put your money in any investment.

Finance has a lot of ways of measuring risk. Standard deviation is used to try to show a range of the possible returns. Max drawdown displays your worst-case scenario. Sharpe ratio provides a risk-adjusted measure of performance. However, very few investors ask about standard deviation, max drawdown, and Sharpe ratios. The people we talk to are most likely to ask “What are the odds of losing money” because they don’t want to see their current savings drop in value.

How strong is your purchasing power?

An important consideration when talking about losing money is purchasing power: the ability to buy goods with your money. Inflation has consistently pushed prices up over time, reducing the purchasing power of a single dollar. Wanting to avoid losing money is completely understandable. The danger of keeping your money under your mattress or sitting in cash is that inflation is constantly reducing your purchasing power.

When concerned with losing money, many investors are focused on nominal returns. Nominal returns are the raw return values, unadjusted for inflation, and are simple to calculate and digest. I would argue that most investors should be focused on real returns: returns adjusted for inflation. Real returns are a more accurate measure of your change in purchasing power. Ultimately, very few outside of Scrooge McDuck want a giant pile of money. Most people want to spend that money on goods, like food, travel, or a home, therefore purchasing power is likely what investors really care about.

Real return = (1+Nominal Return) ÷ (1+inflation rate)

Historically, stocks deliver positive returns, and those returns are in your favor. However, stocks are down (i.e. lose money) more frequently than bonds. The safety bonds offer also means they provide lower returns. What blend of stocks and bonds is most likely to protect your purchasing power (i.e. produce a positive real return)?

inflation is dwindling BOND power

To try and answer this question, I looked at the Stocks, Bonds, Bills, and Inflation (SBBI) data from the CFA Institute from 1926-2020. This data included monthly and annual returns; the annual data is for each calendar year. For stocks, I used the Ibbotson SBBI US Large-Cap Stocks total return.

For Bonds, I used the Ibbotson US intermediate-term (5 year) Government Bonds total return. I looked at several different portfolios which include a variety of stocks and bonds. Specifically, I blended the stocks and bonds in 10% increments, from 100% stocks, to 90% stocks 10% bonds, to 80% stocks 20% bonds, and so on to 0% stocks 100% bonds. I also assumed the portfolios were rebalanced at the start of each return period (i.e. the weights were reset at the start of each month for monthly data, and the start of each calendar year for annual data).

I took these different stock/bond portfolio mixes, and I calculated the nominal and real returns from 1926-2020 for both monthly and annual (calendar year) returns. I then calculated what percentage of returns were positive to measure the chance of losing money (nominal returns) or purchasing power (real returns). I’ve graphed the nominal vs real returns for monthly and annual returns below.

bonds-monthly-returns.jpg
bonds-annual-returns-v2.jpg

You’ll notice the nominal monthly returns paint a clear picture. If you want positive nominal returns more often, you want to own more bonds, hence the steady upward trend to the graph. If you look at the annual nominal returns and want to maximize your chances of a positive nominal return, you actually want a 10/90 portfolio (10% stocks, 90% bonds). As risky as stocks seem, having at least a sliver of stocks actually increases the chances of a positive nominal return

The real returns tell a slightly different story. For the monthly real returns, the stock/bond mix is almost irrelevant for producing a positive return, and hovers right around 60%. There is a drop off after 10/90 (10% stocks, 90% bonds), indicating owning even just 10% stocks in your portfolio helps increase your chances of positive real returns better than owning 100% bonds.

For the annual real returns, you can see that your odds of a positive real return are better with at least some bonds in the portfolio. Interestingly, the 70/30 portfolio and the 20/80 portfolios produce the highest chance of a positive real return. The all bond portfolio, 0/100, has the worst chance of maintaining your purchasing power (i.e. producing a positive real return).

Stocks can seem risky, and the loss of value can make many investors shy away. Even just a small amount of stocks can protect your purchasing power better than owning only bonds. There are still many considerations for how you should invest including your risk tolerance, time horizon, and holistic financial plan. If you’re interested in talking to an advisor, please reach out to us at hi@humaninvesting.com or 503-905-3100.


Related articles

Your Pre-Retirement Checklist
 

Transitioning into retirement can be an exciting time. For many it can also be a daunting reality. We hope the following Pre-Retirement Checklist is a helpful tool as you intentionally prepare for your retirement years.

5-10 years out 

  • Create a plan to pay down debt.   

  • Maintain Emergency Fund – Emergencies still happen in retirement.  

  • Familiarize yourself with Social Security, Pension, and/or Defined Benefit options.  

  • Consider Long Term Care (LTC) options – LTC Insurance vs Self-insuring using other assets.  

  • Maximize all tax-advantaged savings accounts – 2021 Contribution Limits.  

  • Review your investment strategy to make sure your retirement accounts are in line with your risk tolerance and timeline.   

  • Strategize how to divest from company stock.  

2-4 years out 

  • Devise a retirement spending plan:   

  • Begin developing a plan for a fulfilling retirement (goals, purpose, health).  

  • Practice being retired – take a long vacation in the location you plan to retire and live within your retirement budget. 

  • Retirement Living Plan:  

    • Evaluate downsizing a home or relocation and the associated tax implications.  

    • If a mortgage is required, relocate while you still have the income to qualify for the mortgage preapproval process. 

  • Formulate a plan to exercise your stock options

  • Review insurance needs – potentially to cancel or lower life/disability insurance.  

< 1 Year out 

  • Formulate a health care plan:   

    • Investigate Medicare, Medigap, and Medicare Advantage plans.  

    • Compare Individual Insurance policy or COBRA if you are younger than age 65.  

    • Enroll in Medicare 3 months before age 65.  

  • Apply for Social Security benefits 3-4 months before you want benefits to start.  

  • Determine how much monthly income you need from your portfolio to cover your expenses.   

  • Analyze your retirement income plan.

  • Consider a HELOC while you still have the income to qualify.  

  • Update estate plan documents with retirement changes.  

  • Take advantage of employer medical plans.   

Download this as a printable one-sheeter.

Planning for retirement should be exciting. Please reach out if our team of credentialed experts can help you navigate the road to retirement.


Related Articles

Charts of Q2 2021
 

Summer is here! We hope you are enjoying the extended daylight and are spending time with family and friends throughout the upcoming months. To recap the past quarter, we are sharing some topical charts with you.

INFLATION

Recently, the US inflation rate reached a 13-year high. As a result, there has been an exhausting number of headlines published about inflation recently. Unfortunately, inflation buzz creates a lot of noise from people trying to predict something that is not predictable. Will interest rates rise? Will there be a surge in US spending or saving? Will more production occur inside the US? As the chart indicates, inflation itself is always fluctuating. Due to the unpredictable nature of inflation, we do not recommend making financial decisions based on headlines.

Source: The NY Times

THE RISE OF GASOLINE PRICES

Remember when oil producers had to find places to store their oil during the early stages of the pandemic? Since then, the price of gasoline has been steadily rising. If you get sticker-shock from filling up your car’s tank of gas, remember that there are many factors that affect oil and gas prices. For example, seasonal demand, commodities speculation, and the value of a dollar all impact gas prices. To reduce the amount of money you spend on gas this summer, we recommend inflating your tires to increase fuel efficiency or simply riding a bicycle this summer!  

Real Estate Prices are Soaring

We included a chart about housing prices in our Q1 Charts post, and for homebuyers there hasn’t been much great news since then. Real estate prices are still surging. For a visual, see the chart comparing the rise of home prices in Portland, Seattle, San Francisco, and the National Case-Shiller index since 2018.

Real estate prices are a result of inventory issues, the heightened cost of lumber for new construction (see chart below), and many people relocating their residency since the pandemic. If you haven’t experienced it yourself, we all know someone who has been outbid on several houses making the home buying experience feel impossible.

The Child Tax Credit Revamp

The Biden Administration revamped the child tax credit for 2021. The updates include a larger credit amount, monthly payments, more age eligibility, and a fully refundable credit. Overall, this is good news for parents. Like most tax code updates, this child tax credit will certainly cause some confusion. These two visuals should help outline the general updates as well as an example of how the updates would impact the fictitious Mohamed family of four.

As you can see, the Mohamed family is expecting to receive both more money and money sooner than they did last year. However, they will receive a $3,000 credit at the time of their tax return compared to $4,000 in 2020. Given the complexities of the new child tax credit, our team will continue to publish information on this topic in the coming months.

Robinhood Reveals Revenue

Robinhood recently publicized their financial statements in preparation for their Initial Public Offering. In their S-1 public filing, Robinhood disclosed that more than 50% of their users are first-time investors. That comes as no surprise given their reputation of being a democratizing platform. Over the past several months, our team at Human Investing has fielded more commentary about investing with Robinhood than ever before.

Prior to the release of the S-1 public filing, it was easy to imagine the average Robinhood investor as someone with a few extra dollars and a desire to buy/sell individual stocks. However, once Robinhood disclosed the breakout of their revenue we can see that most of their earnings (at least in Q1’21) is derived from investors trading options trading options as opposed to buying/selling individual equities.

Source: Robinhood’s S-1

That concludes our Q2 2021 Charts, and we look forward to sharing more charts with you in the coming months.


signature-HI Team.png
 

Related Articles

ChartsHuman Investing
Four Unique advantages of Social Security
 
blog image.jpg

Social Security is something we contribute to all our working years, so why don’t we know much about it? What sets it apart from other retirement benefits? I want to briefly share some of the characteristics that make Social Security unique and helpful for retirement planning purposes.

Social Security Includes Spousal Benefits

Social Security spousal income is a benefit provided to married couples. If you have a working income that is less than 50% of your spouse’s normal retirement age benefit, a spousal benefit will be added to your Social Security income to make it equal to 50% of your spouse’s income. Even with no working income (homemaker), 50% of the spouse’s normal retirement age income will be received.

To receive this increase in income, the higher-earning spouse must start their benefits before the spousal payments begin. Check your eligibility for spousal benefits here.

Two more things to note:

  • There is no benefit to delaying spousal income after normal retirement age as it does not continue to grow.

  • If the spouse with the higher income predeceases the spouse with the lower income, the surviving spouse will receive the higher of the two incomes for the rest of their life. For example, let’s say Joe has a social security benefit of $2,800 per month, and his wife, Shirley, has a benefit of $1,400 monthly. At Joe’s death, Shirley will receive $2,800 per month rather than $1,400 per month.

Social Security income is not fully taxable

If you are Married Filing Jointly and have a combined income below $25,000 in 2021, you will not owe taxes on social security benefits. If your income is between $25,000 and $34,000 in 2021, 50% of benefits will be subject to taxation. With income over $44,000 in 2021, a maximum of 85% of benefits will be taxable. Social security income is not subject to Oregon state income tax.

Social Security Income varies based on retirement age

You can start taking social security retirement benefits at the age of 62, but if you are able, it is best to delay taking benefits until normal retirement age (typically age 66). Furthermore, delaying benefits until the age of 70 is even more advantageous, as your income will continue to increase by a certain percentage (based on birth year) until then.

Remember: If benefits are claimed before normal retirement age, half of the benefits will be withheld if income is over $18,960. Benefits will be recalculated at normal retirement age, but it is more beneficial to delay taking social security if someone is planning to work. After reaching normal retirement age, unlimited earned income will not reduce your social security income.

Social Security Income is protected from inflation

Each January the IRS/SSA increases benefits by the amount of inflation experienced over the previous year. These cost-of-living adjustments (COLA’s) are credited even when delaying benefits to a later age. The most recent cost of living adjustment was 1.3% in January 2021. The average estimates over a long period of time are 2.6% annually.

Things to note when applying for benefits:

  • Ensure you have Federal withholdings taken from your benefits, often at 12%.

  • Remember, your Medicare Part B premiums ($148.50 per check) will be deducted from your benefit if you are over age 65.

  • Apply online at www.socialsecurity.gov, by phone at (800) 772-1213, or in person at a Social Security office using the office locator. If you have any questions about social security benefits, please schedule a time to chat.

References:

www.ssa.gov

The Baby Boomer’s Guide to Social Security, Elaine Floyd, CFP®


Related Articles

Biden's New Tax Proposals and What They Mean For You
 

With each presidential election comes a slew of new tax proposals and changes that are sometimes difficult to decode. News outlets mix proposed and enacted laws, furthering the stress that comes with determining how they will affect your taxes.

The biggest takeaway from Biden's new tax law proposals is that those who earn under $400,000 of income per year should not expect to face an increase in taxes. In fact, they are likely to see more tax credits that will help reduce their tax liability. However, those who make above $400,000 could be significantly affected by several of the proposed tax law changes.

Below is an outline of the administration’s current proposals that may become laws in the coming tax seasons based on your yearly income.

for THOSE WHO MAKE BELOW $400,000

What’s been enacted: The Dependent Care Tax Credit.

Eligible childcare expenses increased from $3,000 to $8,000 ($6,000 to $16,000 for multiple dependents) and the maximum reimbursement rate has increased from 35% to 50% for a maximum credit of $8,000. It is refundable for the 2021 tax year. If you pay for childcare services in 2021 for children 12 and under, you can claim those expenses in tax credits up to $16,000.

blog pic 1.png

The Child Tax Credit has temporarily increased from $2,000 to $3,000 per child ages 6-17, and $3,600 per child aged 0-5 for the 2021 tax year. There will also be monthly payments made from July to December 2021. Half the total credit amount will be paid in advance with the monthly payments, while the other half will be claimed on the tax return that you will file next year. For example, if a single filer with an AGI of $60,000 had one 13-year-old child, they would receive $250 per month from July to December and $1,500 as a credit on their 2021 tax return.

blog pic 2.png

The increase (i.e., the extra $1,000 or $1,600) is gradually phased-out for joint filers with an AGI of $150,000 or more, head-of-household filers with an AGI of $112,500 or more, and all other taxpayers with an AGI of $75,000 or more. At $440,000, couples will phase out of the tax credit entirely.

What’s been proposed: First-Time Homebuyer’s Tax Credit reinstated for up to $15,000 in refundable credits.

You may not have owned a home within the last 3 years to qualify for this credit. You must make no more than 160% of the area median income, and the home’s purchase price must be no more than 110% of the area median purchase price. You could claim this credit for primary residences purchased after Dec. 31, 2020.

for Those Who Make Above $400,000

What’s been proposed: Increased income tax

Currently, the top individual income tax rate is set at 37% on earnings above $622,050 ($518,400 for those filing single). The new proposed rate is 39.6% for earnings above $400,000.

blog pic 3.png

What’s been proposed: The 6.2% Social Security payroll tax on income above $400,000.

For 2021, the maximum limit on earnings for withholding of Social Security tax is $142,800. This proposed tax law would result in the 6.2% tax continuing on earned income over $400,000 in addition to the 6.2% tax on earned income up to $142,800. The income between $142,800 and $400,000 would not be subject to this tax. For example, if $450,000 is earned, $50,000 will be taxed at 6.2% resulting in $3,100 paid in SS tax on top of original cap of $8,853.60.

blog pic 4.png

What’s been proposed: Long-term capital gains and qualified dividends be taxed at a rate of 43.4% on income above $1,000,000.

Long-term capital gains above $501,600 ($445,850 for those filing single) is currently taxed at 20%. In addition, they are proposing the elimination of the step-up in basis for transferred assets.

What’s been proposed: Restoration of the limitation on itemized deductions (ie. mortgage interest, charitable contributions, property taxes, etc.) for taxable income above $400,000.

This means your itemized deduction amount would be reduced by the lesser of 3% of AGI in excess of $400,000 or 80% of your itemized deductions. The state and local tax deduction limit of $10,000 could also be removed, allowing for additional deductions in state and local taxes paid above $10k. For example, a person has $750,000 of taxable income, and their itemized deductions total $75,000. 3% of their taxable income above $400,000 = $10,500, 80% of itemized deductions = 60,000. Since the 3% calculation is the lesser of the two, their itemized deduction amount of $75,000 is then reduced/lowered by $10,500, resulting in $64,500 of itemized deductions.

blog pic 5.png

What’s been proposed: Pass-through deductions removed for taxpayers earning more than $400,000.

For business owners of a Sole Proprietorship, Partnership, S-Corporation, and certain trusts and estates, the Section 199A pass-through deduction for qualified businesses could be up to 20%. The maximum deduction is the lesser of 20% of an owner’s QBI, or 20% of taxable income, excluding any net capital gains. If it were to pass, this deduction would no longer be available if the taxpayers net income were above $400k.

What’s been proposed: Estate and Gift Tax exemption rates for assets may be brought back to 2009 rates.

For 2021, the unified federal gift and estate tax exemption is $11.7 million per individual. The tax rate on cumulative lifetime gifts in excess of the exemption is a flat 40% (applicable to taxable amounts above $1 million made while still alive). The estate tax exemption for Married Filing Jointly (2009): $7,000,000. For those filing Single (2009): $3,500,000. The maximum gift tax rate (2009): 45%

BUSINESS AND CORPORATE TAXATION

What’s been proposed: Increased corporate income tax from 21% to 25-28%.

While this may not directly affect your taxes, it may affect any assets you have in company stocks or potential dividends depending on how the corporation decides to deal with the increase in tax.

What’s been proposed: Minimum tax on corporations with $100 million or more in book income.

Corporations would be taxed on the greater of their regular corporate income tax rate or have a 15% minimum tax imposed on them.

It is important to remember that all proposed tax law changes would need to be reviewed and enacted by Congress in order to become official tax law. All proposed law could potentially be revised or eliminated.


How to Maximize your Nike Stock Options
 

For many years, Stock Options have been a foundational part of compensation for Nike leaders.  They have provided a unique opportunity to build significant wealth by participating in the success of Nike.  While Stock Options can have a great impact on your financial landscape, they can also create considerable confusion. In our experience working with Nike leaders, we have found that there are often misunderstandings about Stock Options and how they differ from actual shares of Nike stock. While we are responsible for the financial planning intricacies for our Nike clients, we wanted to provide a background on Stock Options and share the most important factors to fully maximize them.  

What are Nike Stock Options and how do they work?

Nike Stock options are the right to purchase shares of Nike at a set price (exercise or strike price) that lasts for up to 10 years.  I like to think of them as “coupons”, where you can use your coupon to buy an item for a price that is lower than it is currently worth.  Once you have used your coupon, you could proceed to immediately sell that item for the current price, capitalizing on the difference between the coupon price and the current market value.

Value of Stock Option = # of Options x (Current Stock Price - Exercise Price

To illustrate the difference between stock and Stock Options, it only seemed appropriate to use a shoe analogy.  Imagine you are given access to Limited Release Jordan shoes, and you have two different choices to select from:

nike-stock-choice-1.jpg

So which choice is better for you?  It depends on what happens to the value of those Jordans in the future.  Will the value increase or decrease and by how much?  Do you need another pair of Jordans today? Or can you wait until the future to use them? To better understand how it can all play out, we put the 2 Choices against each other in three head-to-head matchups to determine the winner in each situation.


ROUND #1: Value of SHOES drops -10% to $900. 

Shoe Choice: you are still left with shoes that you could sell for $900 or keep if you think the value could recover and grow further.

Coupon Choice: your 10 coupons are worthless since there is no value in purchasing shoes for more than they are worth at $1,000 per pair.

WINNER: Shoe Choice

ROUND #2: Value of shoes increases +10% to $1,100

Shoe Choice: your shoes are now worth $1,100 and the value has increased by $100.  You can sell them or keep them if you think the value could continue to increase further.

Coupon Choice: your coupons would allow you to purchase 10 pairs of shoes for $10,000 (10 coupons x $1,000 per pair).  You could them resell them for $11,000 (10 pairs x $1,100 per pair) and earn a profit of $1,000 ($11,000 value - $10,000 purchase cost).

WINNER: Shoe Choice

ROUND #3: Value of the shoes increases +50% to $1,500

Shoe Choice: your shoes are now worth $1,500 and the value has increased by $500.  You can sell them or keep them if you think the value could continue to increase further.

Coupon Choice: your coupons would allow you to purchase 10 pairs of shoes for $10,000 (10 coupons x $100 per pair).  You could them resell them for $15,000 (10 pairs x $1,500 per pair) and earn a profit of $5,000 ($15,000 value - $10,000 purchase cost).

WINNER: Coupon Choice


THE POST MATCH ANALYSIS

nike-scorecard.jpg

Round #1: Shoe Choice (Nike Stock) won and underscores the risk of Stock Options and how the value can become $0 if the stock price does not increase. 

Round #2: Shoe Choice (Nike Stock) won but only by a small amount.  Even if the stock grows, low growth still favors Nike Stock over Stock Options. This is common if Stock Options are held for a short period of time. 

Round #3: Coupon Choice (Stock Options) won by a significant amount.  Substantial growth in Nike stock will favor Stock Options by a wide margin. 

UNDERSTANDING THE OPPORTUNITY AND RISK

The Shoe & Coupon Choices shows how the Stock Options can perform from the beginning, but what about Stock Options that you already own and have existing value?  At Human Investing, we created a Stock Option Volatility Analysis to show what the upside and downside volatility can be like for existing Stock Options.

nike-volatility.jpg

If you examine the outlined bars, you will note that a 15% increase in Nike Stock price would result in a 101% increase in the value of that Stock Option. At the same time, a 15% decrease would drop this Stock Option value by -101%.  The owner of Nike Stock Options should be prepared and ready to experience significant short-term declines like the ones shown in the chart above.

The key to capturing the upside potential of Nike Stock Options is having a long enough time horizon.  Stock prices can quickly move up and down in the short-term but have a history of growth over the long-term (10+ years).  If you own Stock Options and can wait long enough before you exercise and sell them, that will give you the best probability of maximizing the value.

WHAT HAPPENS WHEN YOU LEAVE NIKE?

Since a longer time horizon is one of the most important components for success with Stock Options, what can disrupt that opportunity?

If you leave (voluntarily or involuntarily) Nike, you typically have up to 90 days to exercise your vested stock options and all unvested stock options are forfeited.  While it is uncommon, there have been some exceptions where the 90-day time period is extended.

In addition, if you meet specific “retirement” criteria, you can receive more favorable vesting for your unvested options.  There are two “retirement” benefits that are unique to Nike stock options:

1) Early Retirement: Age 55-59 with 5 years of Service

  • Unvested Stock Options (less than one year prior to separation) will be forfeited. 

  • All other unvested Stock Options will continue per the original vesting schedule.

  • After your retirement date, you will have up to 4 years to exercise your options. 

2) Normal Retirement: Age 60+ with 5 years of Service

  • Unvested Stock Options (less than one year prior to separation) will be forfeited. 

  • All other unvested Stock Options will become fully vested as of the retirement date.

  • After your retirement date, you will have up to 4 years to exercise your options.

The special retirement vesting options described above can be an extremely valuable benefit to plan for and take advantage of if you are close to or at age 55+.

HOW ARE STOCK OPTIONS TAXED?

As Stock Options vest and grow in value, there is no tax along the way.  Tax is only recognized when you exercise your options.  The dollars are taxed in the same way as your salary, at ordinary income tax rates, which can be as high as 55.45% since it includes federal, state, Social Security, and Medicare taxes.  This can push you into a higher income tax bracket and often disrupts your tax liability if not adequately planned for throughout the year. 

TAX & PLANNING STRATEGIES

Strategy #1 – Spread Option Exercises Over Multiple Years

Since exercising Stock Options creates additional taxable income, carefully exercising the right amount and dividing it over more than one year can help you lower your overall taxes. 

For example, assume you have taxable income is $450,000 and have $350,000 of Stock Options that you want to exercise. Your current income of $450,000 would be in the 35% tax bracket (2021) and you will not move up to the 37% tax bracket until your income exceeds $628,301 (2021).  That leaves room for $178,301 worth of stock exercises that would be taxed at 35% before it reaches the 37% bracket.  If you spread the $350,000 of exercises over two years ($175,000 per year) instead of exercising the entire amount in one year, you could avoid the 37% bracket and save about $3,500 in Federal taxes.

Strategy #2 – Coordinate Option Exercises with the Nike Deferred Compensation Plan

Another strategy is to coordinate the timing of your Stock Option exercise with the contribution of a similar amount of salary and/or bonus into the Nike Deferred Compensation plan.  This strategy requires the following steps:

  • Step 1: Determine the amount of Stock Options you wish to exercise. As an example, we picked $300,000 of stock options to exercise.

  • Step 2: Elect to defer the same amount ($300,000) into the Nike Deferred Compensation plan from your salary during Open Enrollment.

  • Step 3: Exercise and sell $300,000 of Stock Options in the same tax year as you are contributing $300,000 to the Nike Deferred Compensation Plan

  • Step 4: Use the proceeds from the $300,000 of Stock Option exercises to replace your salary and support your living needs.
    In the end, you would have essentially funneled your Stock Option proceeds into the Deferred Compensation plan and avoided paying any additional taxes. 

Learn more about the Nike Deferred Compensation Plan.   

Nike stock options are an incredible opportunity

Although Nike Stock Options are often misunderstood, they can provide an incredible opportunity to generate wealth.  To really maximize of the opportunity, we recommend that you are prepared to navigate the volatility, complexities, and tax strategy. 

If you have any questions or want to know more about how to handle your Nike Stock Options, please get in touch.

You can schedule time with me on Calendly below, e-mail me at marc@humanvesting.com, or call or text me at (503) 608-2968.


Related Articles

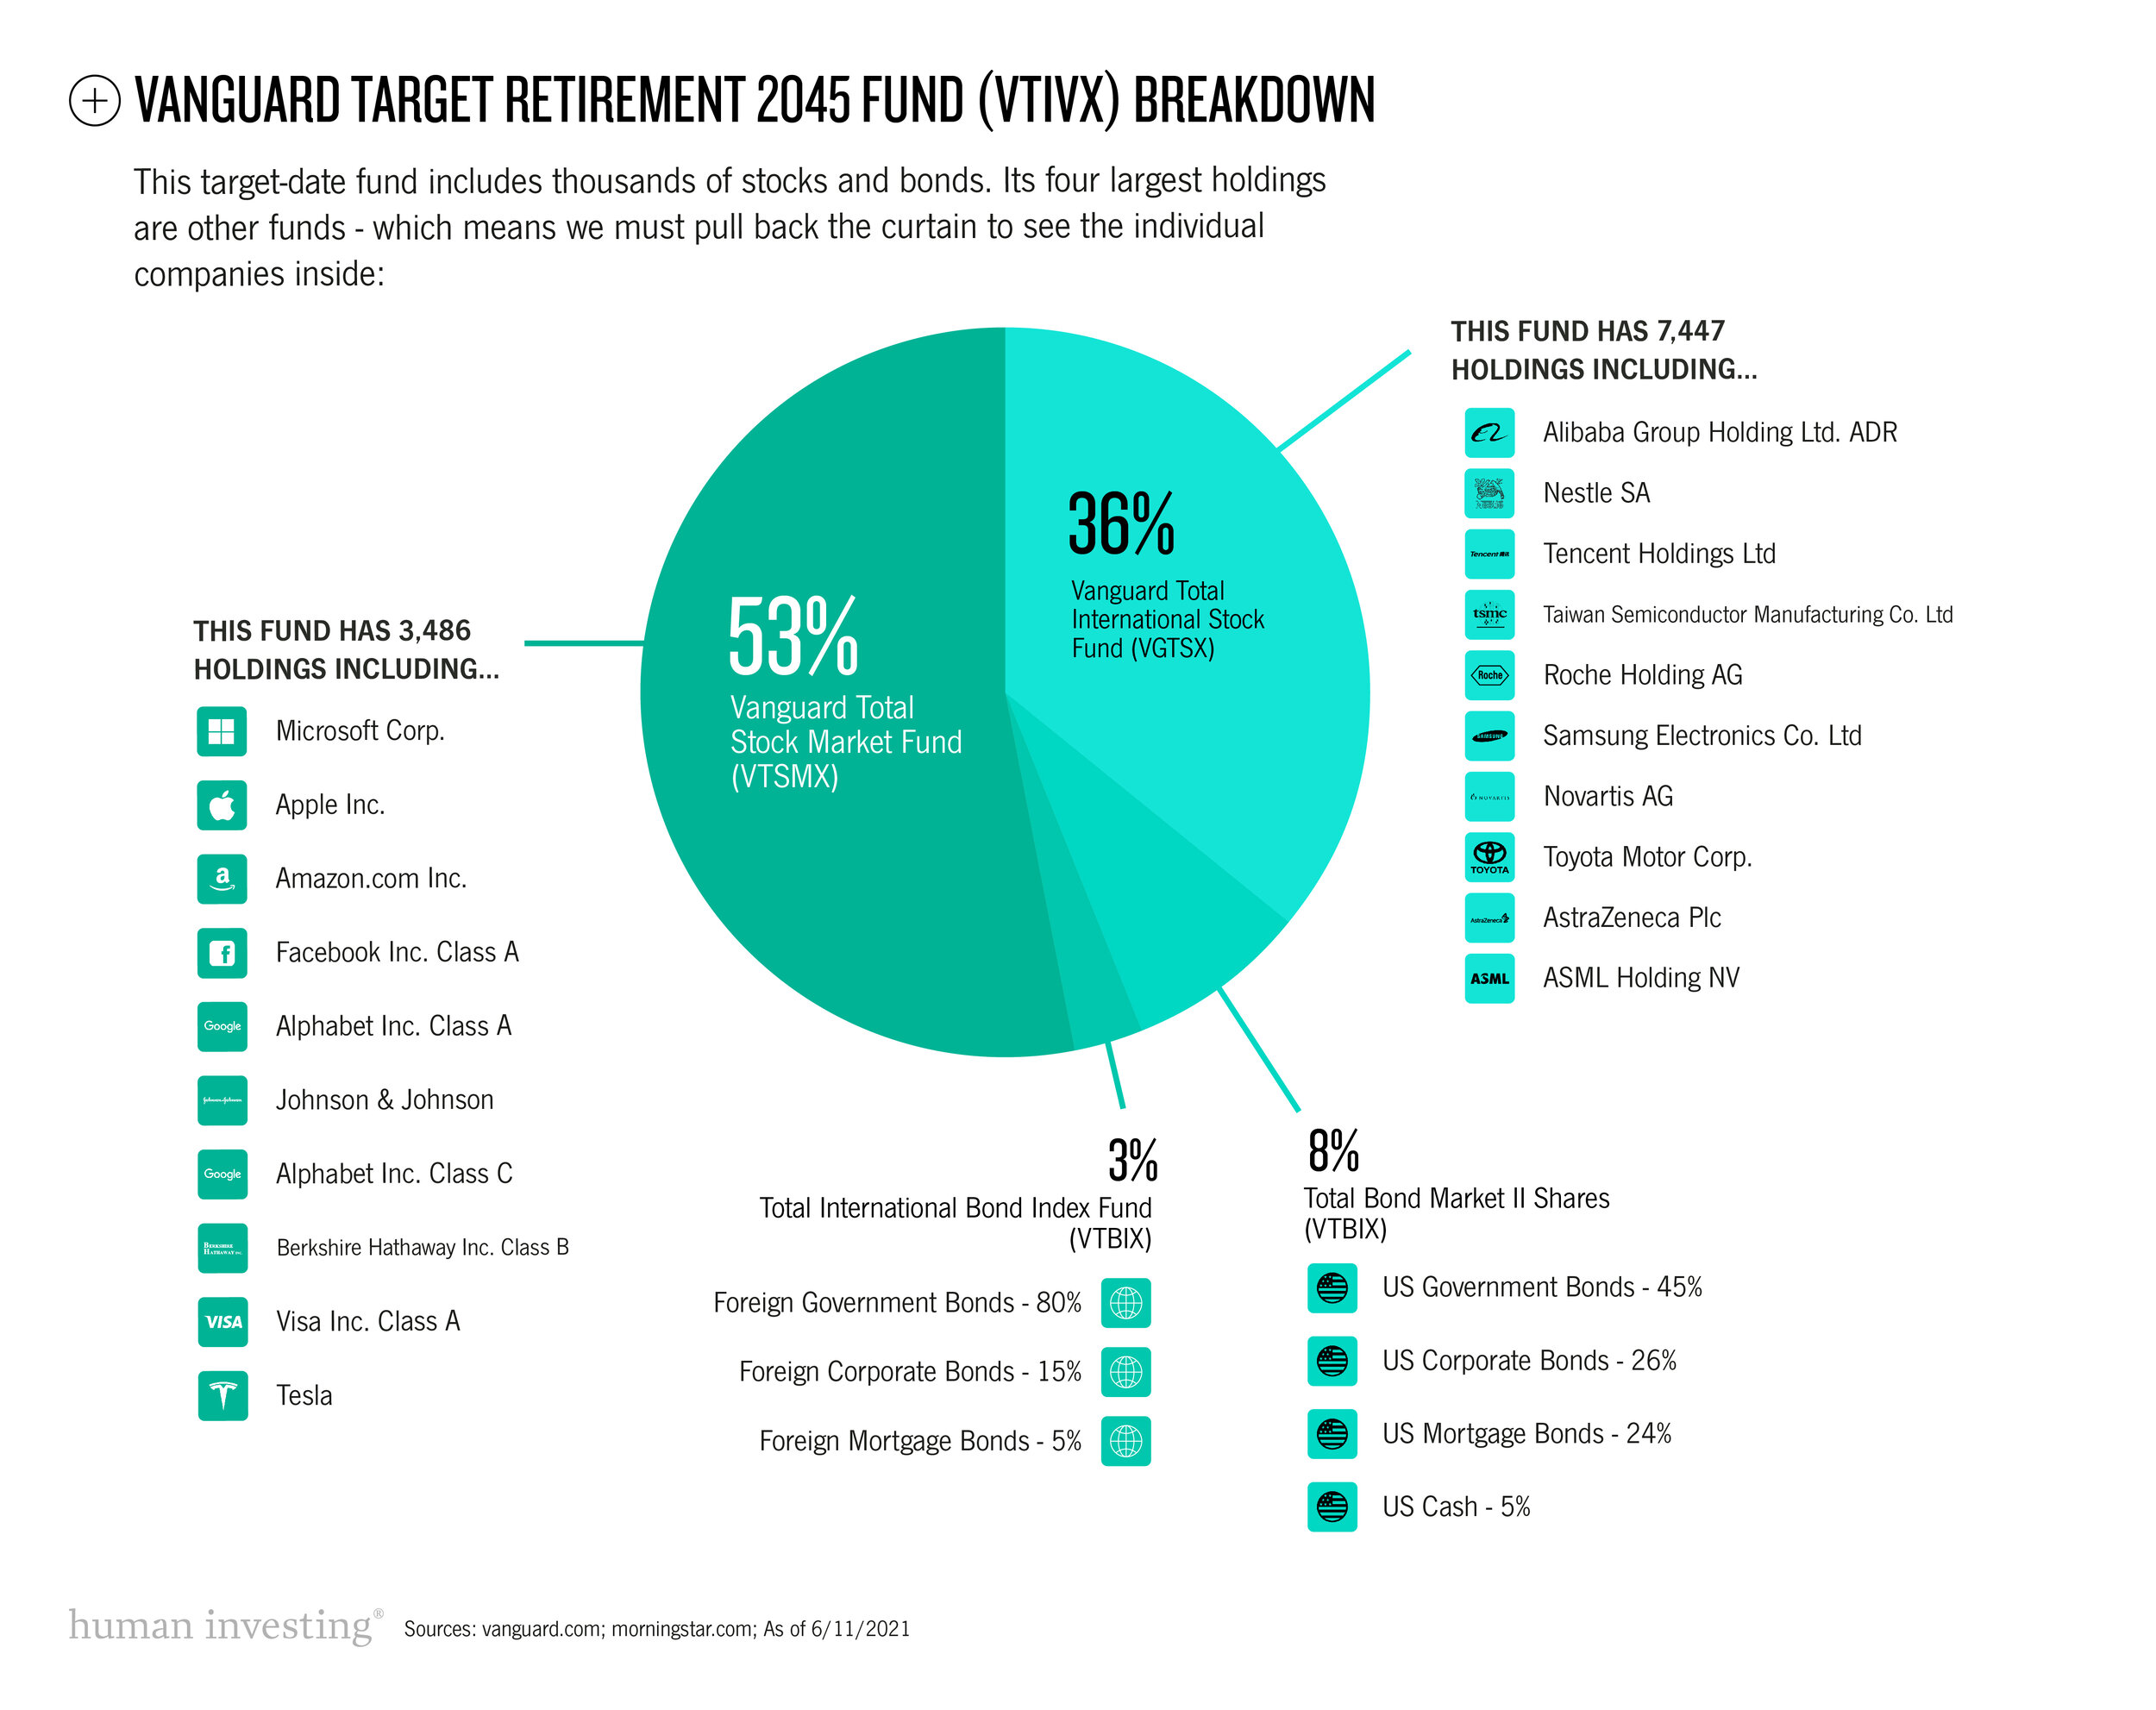
What Individual Companies are Inside my Target Retirement Funds?
 

When you pull back the curtain to see what is inside a target-date fund, there are thousands of individual companies. To help visualize some of the top holdings, we created a graph that illustrates the Vanguard Target Retirement 2045 Fund (VTIVX).

Vanguard Index v2 - 2021-01.jpg

Over time, target-date funds adjust their holdings and asset allocation (stocks/bonds/cash) based on your retirement age. But for now, we hope this snapshot clarifies some of the largest companies inside the Vanguard Target Retirement 2045 Fund. 


Human Investing
Kickstarting Your Financial Plan
 
unsplash-image-PVIbUkN_wCQ.jpg

Not sure what questions to ask when you meet with an advisor?

Here are six questions we commonly get asked with some advice from our team.

1. I want to support my child through college. When should I start saving?

The earlier you save, the more time your money has to grow.

rivermark-01.jpg

The benefits of saving early are dramatic, but there's still value in starting now—even if your child is in high school. The dollars you save will not have as much time to grow, but they are dollars you will not be borrowing. You’ll also be in a better situation if you choose an account that gives you tax benefits, such as immediate tax deductions or tax-free withdrawals.

Still not sure if saving for college is right for you? Check out this article by Peter Fisher, co-founder and managing partner of Human Investing.

2. Should I spend my cash paying off high interest loans, or invest it?

Historically, the average rate of return for stock market investments is approximately 10%, while on average, the APR on credit cards has been hovering just above 20%. So, if you are investing when you have credit card debt, you are likely paying a higher interest rate on your debt than you are earning via your investments. Unless you have a huge amount in investments, you end up losing money overall.

3. When do I start saving for retirement?

Again, start saving as early as possible to give your money maximum time to grow. Depending on your employer, you may already have some form of retirement benefits accruing. There are various ways of saving for retirement, including employer sponsored plans like 401(k) and 457b plans, or personal retirement savings like Roth and Traditional IRA’s. A mix of the two is the best way to ensure ample savings for retirement, but deciding which is best for you requires some analysis of your current and expected employment and income status.

4. Is my investment portfolio right for me?

As you age and get closer to retirement, you want to make sure the risk level of your investment portfolio is balanced to match your growth and maintenance needs. While having all of your investments allocated in the stock market may result in a high return on investment, it can also result in high losses. This can be catastrophic for a person planning on retiring soon. On the other hand, if a young person has a few decades before they are planning to retire, but they are only investing their money in bonds, they are losing out on the potential growth of higher risk investment options.

 Investment in both bonds and stocks allows for a mix of potential income and growth, and the best fitting ratio is different for everyone. Reach out to us to speak with our retirement planning team to discuss your current allocations. We care here to help better prepare you for a comfortable retirement.

5. What should my emergency savings look like?

The most common numbers suggested for an emergency fund is 3-6 months’ worth of your current living expenses. These include expenses such as housing, food, healthcare, debts, and so on. You do not need to include things like entertainment, nonessential shopping, or vacation expenses. If you are, you have too much going into your emergency savings fund that could be invested elsewhere. Below is a chart showing example savings amounts and how they compound over the course of two years.  

6. When should I begin utilizing expert tax services?

You may be at a point where using your preferred e-file service to do your taxes is still getting the job done just fine, but at what point do they get too complicated for you to be doing them on your own? Once you begin to deal with things like property taxes, retirement plans, and investments, it may be best to have an expert handle the numbers for you.

Luke Schultz, the Director of Tax at Human Investing, has over 12 years of experience in the areas of tax compliance and planning. With a heavy focus on planning, he spends much of his time working closely with individuals, putting emphasis on proactive planning to help clients make the best decisions for them and their families.

Want to get started?

Schedule an appointment with an advisor here or feel free to call us at 503-905-3108.

Sources:
Vanguard, When should you start saving for college?
The Balance, Rule of Thumb: Should I Pay Off Debt or Invest?
Money Under 30, Should You Pay Off Student Loans Early?


Related Articles

Charts of Q1 2021
 

The start to 2021 was eventful for our team at Human Investing. Since the beginning of January, we watched the markets and headlines respond to the capital siege, the GameStop phenomenon, and another stimulus bill. Now that Q1 2021 is over, our team is sharing five of our favorite charts we have seen circulate this quarter.  Enjoy!  

Chart 1: Gamestop

January 2021 was the GameStop month. Even though it seems like this frenzy is over, we expect the GameStop phenomenon to remain relevant in the months and years to come. We are sharing a simple chart that captures both the price spike and trading volume spike.

While there are many takeaways from this short squeeze, one important reminder is to always keep your investment strategy the forefront of your decision-making. When will you be spending your dollars? What will the dollars be spent on? Remember that both your savings and your investment strategies are likely different from your neighbors, your headlines, and your influencers.  

chart-01.jpg

Chart 2: Bull Markets

This chart highlights the annualized returns of recent bull markets.  As illustrated at the bottom, 2020 was an extraordinary year for market returns with an annualized return of 79.4%. This annualized return was not predictable, but it shows the importance of staying invested during a market downturn.

What does this mean for you? Do not take your investment returns this past year for granted! If you have created an investment strategy, stick to your game-plan. Past results do not guarantee similar future returns.

Chart 3: Price Changes

If you attended one of our group presentations recently, then you may have already seen this inflation chart. As illustrated in this chart, we want to emphasize that hospital services and college tuition are 165% more expensive today than in the year 2000. Let this chart be a reminder to plan for these big expenditures. Also, next time you watch TV – give it some appreciation. TV’s are a prime example of a technology that has not only gotten smarter and faster, but also more affordable over the years.

Chart 4: U.S. Savings Rate

This chart visualizes the U.S. Savings Rate before the pandemic, during the height of the pandemic, and the savings rate five months after the stay-at-home orders were released in the US. Notice that the precautionary savings increased significantly in April and May 2020, but has decreased ever since?  We encourage you to review your precautionary or “emergency savings” and to contact our team to strategize ways to make it happen.

chart-04.jpg

Chart 5: Home Sales

As Portland residents, we know how difficult it is to buy a home here. According to Redfin, the median sale price in Portland is up 22.4% year-over-year and the median days on the market is down 67.5%. While this may be a favorable scenario for current home sellers, it is obviously a distressing situation for home buyers. We recommend reading the New York Times article for a full analysis on the national housing inventory and reasons why the number of homes for sale has plummeted.

That concludes our Q1 2021 Charts post. We promise to post our favorite charts from Q2 2021 this summer!  


signature-HI Team.png
 

Related Articles

ChartsHuman Investing