Posts in Investment Strategy
Consider your timeline for Nike stock


Since the recent Nike quarterly earnings report, the stock price dropped 20% in one day (June 28, 2024) and continues to hover around $72 - $75 per share. This has raised concern for employees as they rely on Nike stock to fund a significant portion of their investment strategy and lifestyle needs.

Below are 4 thoughts on the recent price drop and action items you can implement to move forward during this downtime.

Give yourself time to recover

 It’s easy to lose sight of this when the stock price is rising. The focus goes towards remaining invested for as long as possible so you don’t miss additional investment gains and forget that volatility can disrupt your strategy.

In our blog post from August 1, 2022, we analyzed the recovery period for Nike stock price when there is a 20% downturn. We can’t predict how long this recovery period will take, but history tells us that on average, it takes 339 days.

Action Items:

  • Stock options: The most common approach is to exercise and sell your Stock Options by converting it to cash before the expiration deadline. You may want to consider the less common option to exercise and hold the stock. This gives you an indefinite timeline to hold the stock and strategically wait until the right time to sell. For the exercise and hold strategy, you need to have cash to purchase the stock. For example, to exercise and hold 100 shares at $75 per share, you need $7,500 cash to purchase, so plan accordingly.

  • Strategically diversify: Diversify new ESPP and RSU purchases. Selling new shares at the time of purchase does a couple of things: (1) Avoids the risk of loss in value, (2) allows you to diversify into a balanced investment portfolio, and (3) gives time for your older Nike stock purchases to recover.   

Strategically raise funds when needed to minimize taxes

Rather than focusing on “how much cash do I need”, look at each of your Nike investment buckets and determine how you can get the cash you need in a tax-advantaged way.

Action Item:

  • Tax analysis: For RSUs and ESPP, look at each Lot to determine which holdings would sell at a capital gain and which would sell at a loss. Review critical factors such as (1) how much cash do I need, (2) how much investment will remain, (3) what is the net tax impact of what I’m selling, and (4) how long until I need to raise more funds.  

Re-evaluate your financial plan

When the stock price is down, it’s an opportunity to evaluate whether changes to your financial plan are required to stay on track with achieving your long-term goals.

Action Items:

  • Maximize benefits: Specifically ESPP stock while the price is low. At the next ESPP enrollment, consider increasing your deferral percentage to the maximum of 10%. 

  • Adjust investment strategy: Evaluate your overall concentration of Nike stock. If Nike stock is a large portion of your overall investment portfolio, consider ways you can maximize your savings going forward into a diversified portfolio to reduce your overall exposure.

  • Stock choice: Think about your upcoming Nike stock choice. If you’ve taken 100% RSUs in the past, does it make sense to change your strategy to 50/50 stock options or 100% stock options?

  • Prioritize your expenses: Determine which expenses are most important to you. Consider reducing or delaying expenditures that do not align with your highest priorities. This approach can feel difficult at first, but the more you buckle down during this season, the greater impact it will have on your financial plan.

Re-visit your college savings plan

Many Nike employees rely on their stock options to fund their kid’s college expenses. If this was your strategy, your options are underwater unless you have grants from 2014 (which expire soon) – 2017.

Action Items:

  • Evaluate other funding sources: Do you have other investment levers that can be used to fund college expenses?

  • Cash flow: How much cash flow do you have within your annual budget to fund college expenses? Will this be sufficient to cover part or all of the expected cost?  

  • Deferrals: If you reduce your retirement deferrals, will this increase your cash flow enough to fund annual college expenses?

  • Prepayments: If you are pre-paying any loans (ie: paying extra on your monthly mortgage), consider paying the minimum to free up cash flow for college expenses.   

  • Grants and scholarships: Are there opportunities to explore this further?

  • Adjusting expectations: Does this prompt a discussion with your kids around sharing the cost of college expenses?  

Consider your timeline. When Nike stock is increasing, it’s easy to lose sight of your timeline because the focus is not missing out on the appreciation. The recent volatility is a reminder that time is the most valuable asset when investing. The action items above are the starting point to navigate through the volatility. Please reach out to us so we can continue the discussion and help implement these strategies to remain on track with your long-term financial goals.


Related Articles

How Long Does it Take for Nike Stock Downturns to Recover?
 

On November 5th of 2021, Nike stock closed at its most recent all-time high of $177.51. Much has changed since that time, with the stock price dropping over 38% to $109.12 as of 7/22/22. This has made financial decisions much more challenging for Nike leaders that hold and receive significant amounts of Nike stock as part of their compensation and benefits. Many rely on their stock for their financial goals and life plans like retiring, paying for college, paying off debt, contributing to charitable causes, and purchasing a vacation home or a new car.

Uncertainty and concern

Those decisions are now met with uncertainty and concern over the significant decrease in their Nike shares compared to just seven months ago. So, the understandable questions are starting to arise:

“Should I sell some or all of my stock now?”

“Should I delay my financial goals and life plans?”

“Is there another way to fund those goals without selling my stock?”

“How long do you think it will take to recover?”

Each individual has a unique financial situation, and the right decision is not the same for everyone.

To help Nike clients through these discussions, we thought providing information and context to the question of how long it will take for the stock to recover would be helpful.

While we cannot predict the future, we can look to past situations to get a sense of general time frames, which can help the decision-making process.

How Long Will this Down Period Last?

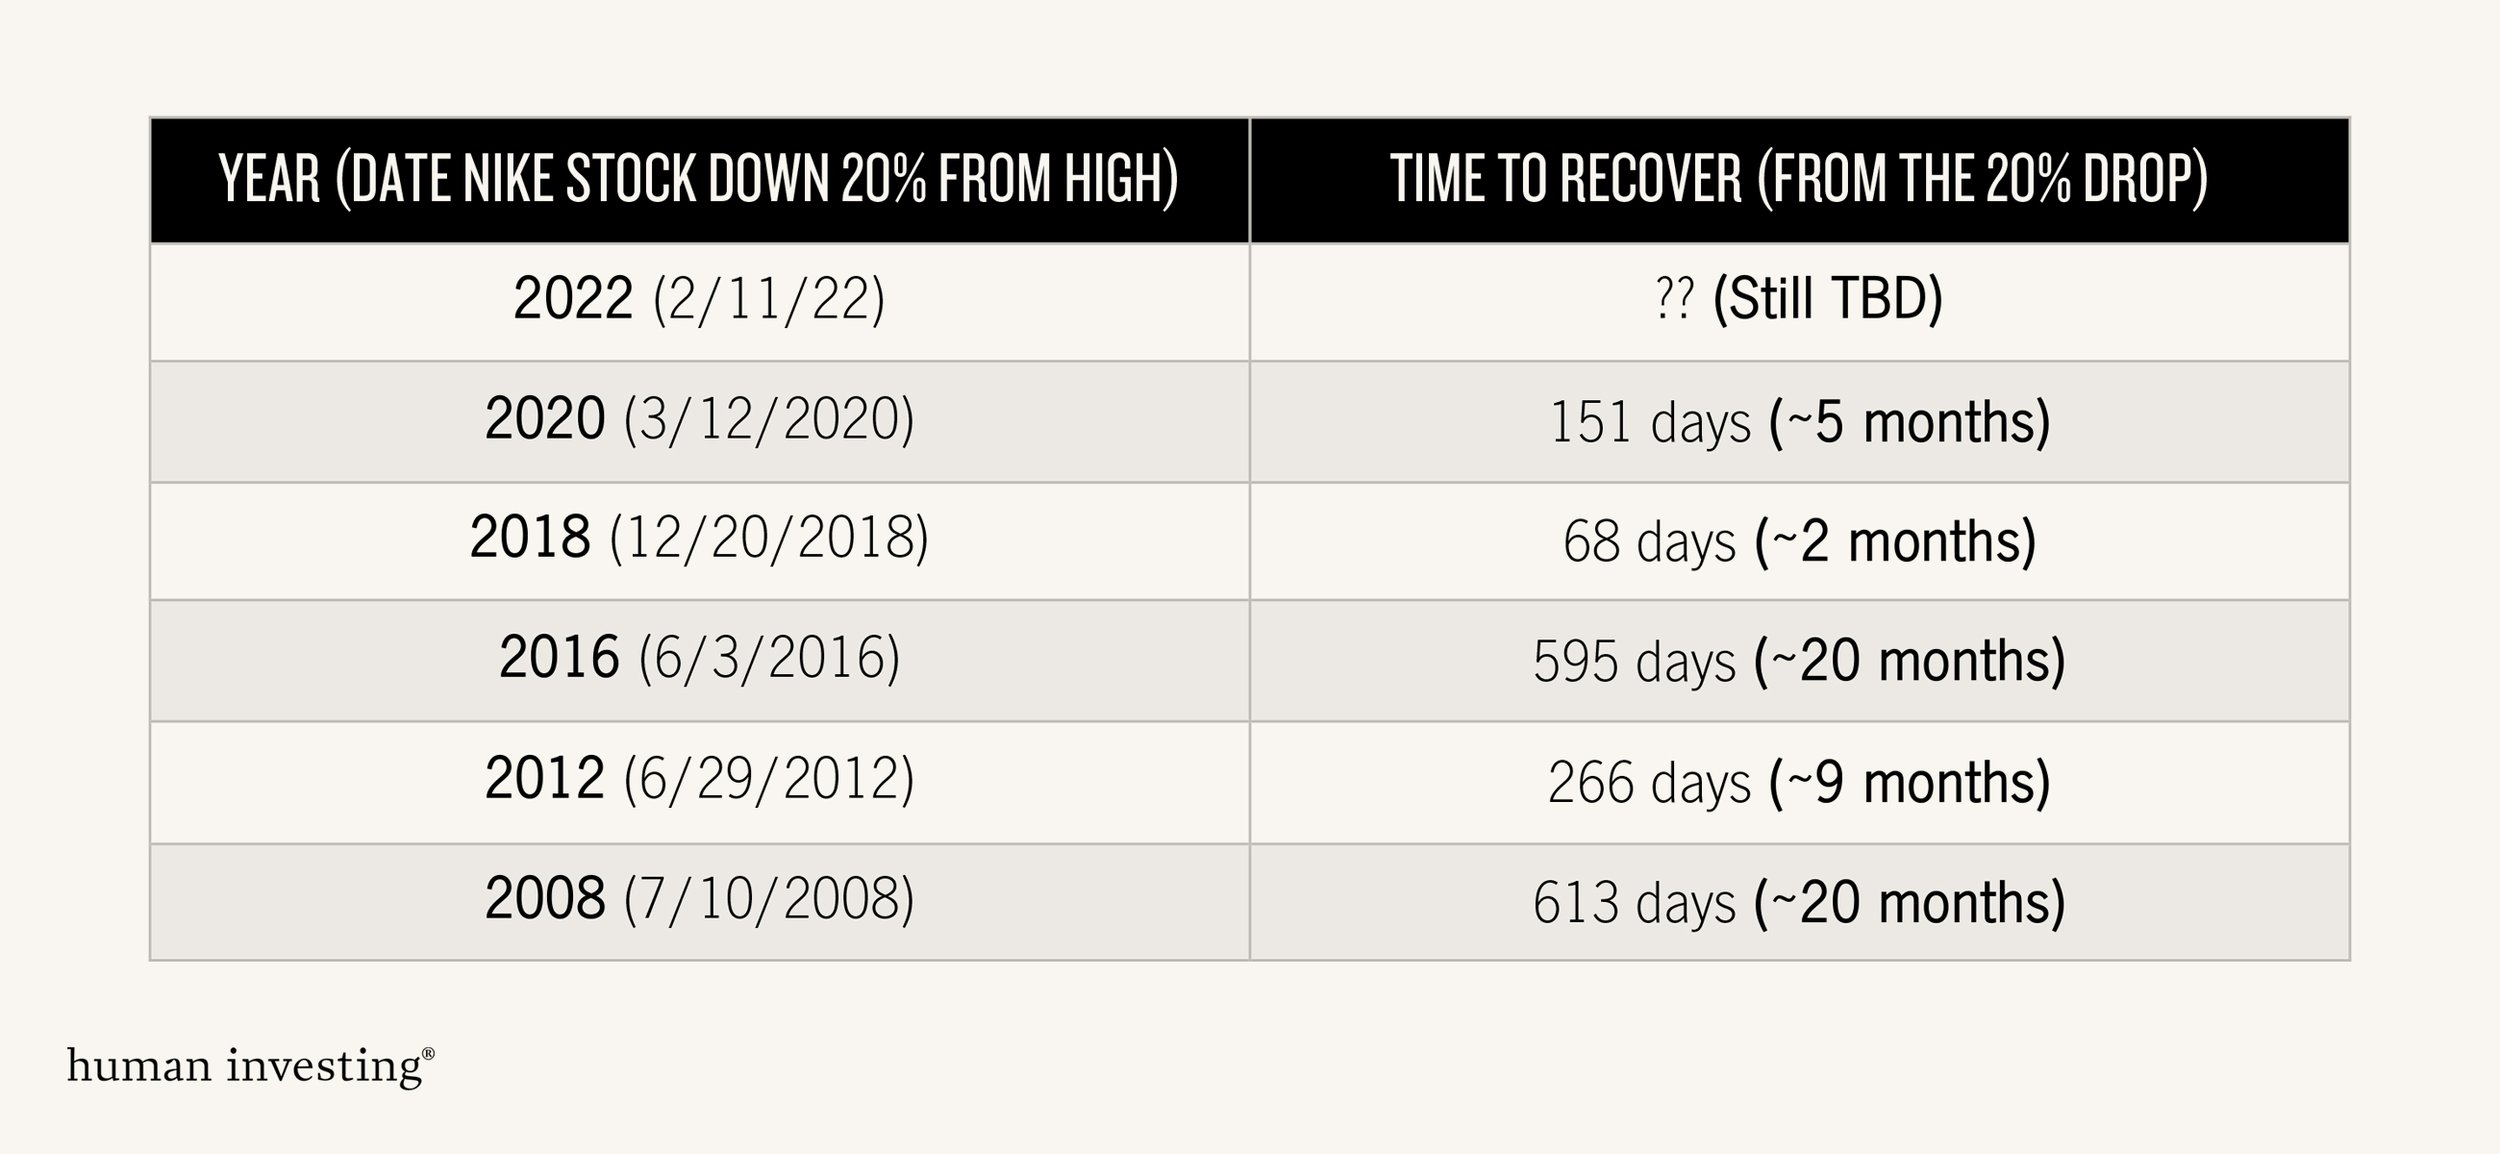
In examining the last five times Nike stock dropped by at least 20% from its high, we noted the periods to recover to their all-time high.


The average time for recovery has been just under one year at 339 days. You will notice from the table above that the recovery time varies widely from as quick as two months to as long as 20 months. Another interesting observation is that over the past 15 years, there has been a 20%+ drop in Nike stock every 2-4 years.

This most recent -20% downturn in Nike happened on February 11, 2022, about five months ago. So how much longer will this down period continue? No one truly knows, but if we go off of the history of the past 15 years, you should be prepared for up to another 15 months.

So, what should Nike leaders consider and assess now? Below are some tips.

TIP #1: Assess and Understand your Time Frame

Having enough time to be patient and wait for a potential recovery is one of the keys to the current environment. Take time to assess if you can hold tight or if you have very specific timelines or deadlines like a Stock Option expiration.

TIP #2: Take Note of your Risk Appetite

Even if you have the time to wait for a potential recovery, it may not be worth it if it is causing an undue amount of stress and anxiety. In this case, we find that developing a well-thought-out selling plan, where you sell part of your stock at different prices and time periods, can relieve some of the concern.

TIP #3: Develop a Contingency Plan

If the stock takes longer to recover than expected, identify other places where you can access cash in the short-term to meet those financial goals.  Examples can include: using existing cash in the bank, the conservative part of a taxable investment account, a home equity line of credit, or a portfolio loan.

TIP #4: Pick the Most Optimal Shares for any Sales

When the time is right to sell, are you picking ESPP, RSUs, or Stock Options?  We recommend carefully selecting the right type and exact shares to minimize taxes, maintain your long-term upside, and fit your time frame.

By looking into the past, we can see that downturns and recoveries in Nike stock are pretty standard and have happened regularly. We recognize that this historical data doesn’t mean it will be the same this time, but it does give you a sense of what it could look like.

“History never repeats itself, but it does often rhyme.”

-Mark Twain

If you need help assessing your current Nike stock and how it fits into your personal goals and situation, you can reach Marc at marc@humaninvesting.com.


Related Articles

Is Inflation Affecting your Investments?
 

Inflation can lay waste to portfolios and wages, which is one of many reasons why inflation is concerning for laborers and investors alike. Some speculate that the rise in inflation is from supply chain congestion, resulting from labor shortage due to the Coronavirus pandemic. Others hypothesize that a flood of liquidity into the global economy, which stems from quantitative easing dating back to the financial crisis in 2007-2009, is the cause of rising prices. Regardless of the reason, the concern is that gains in wages and market appreciation are muted, or worse, erased, by an escalation in prices for goods and services.


Inflation’s History

It has been three decades since we've seen inflation at current levels and even longer since inflation averaged double digits (several different times in the mid-70s to early 80s)[1]. Clients of our firm who remember the 1970s recall long gas lines, borrowing for a home purchase at 15%, and investing in treasury bonds at over 10%.

Consider this: in October of 1981, the 30-year mortgage rate was 18.45%[2]. As I type, that sort of rate seems almost unthinkable, yet it's true. To illustrate how it would impact the average homeowner or investor today, imagine a $500,000 home purchase with a 20% down payment. An individual would be financing $400,000 and be left with a $6,175 payment!


How Does Inflation Work?

Inflation works in a similar way with food, gas, and other products and services we use regularly. Inflation can be viewed as a tax that leaves consumers with less to spend at the end of each month. With consumers facing higher prices, the dollars they spend must go to the staples such as food, housing, and gas—while potentially having less to spend on discretionary items such as travel and entertainment.

To combat inflation, the Federal Reserve (the Fed) will typically increase short-term borrowing costs on member banks—which in turn, trickles down to the consumer. Managing inflation is a primary objective of the Federal Reserve. The inflation target for the Federal Reserve is 2%. With both headline and core inflation trending well above those targets, aggressive rate increases are warranted. Surely the invasion of the Ukraine by Russia has complicated the Fed’s rate decision. My previous article “War and the Market: What Does History Teach Us?” discusses this topic further. Despite the concern over the war in Ukraine, the question is not if the Fed will raise rates. Instead, it’s a matter of how fast the Fed will hike rates and when they will stop.


Our Recommendations

First, revisit your budget. See where you are seeing the biggest increases as some individuals are impacted far more than others. For example, my brother is a sports fisherman who is impacted much more by the price of fuel than I am with a five-mile commute to work. At the same time, a family of seven will feel food inflation much more than my parents, who have been empty nesters for almost 30 years. Secondly, once you have revised your budget, a conversation with your advisor can be warranted. For some who are living off a fixed income, the process will require pairing back or needing larger distributions from your portfolio. For others, it may prompt a change in your investment mix. While for many clients, the process may entail staying the course.

Investors whose investment horizon is long-term should continue to invest in a diversified, low-cost, equity-leaning portfolio. However, for investors who are either uneasy with market gyrations or have a more condensed investment timeline, multiple levers can be pulled to potentially position the portfolio to hold up well during inflationary times. Many experts agree that treasury bills and private real estate hold up well during inflation. [3],[4] It is also important to note that during inflation cycles, equities do well; however, volatility can increase, making maintaining a portfolio heavy on stocks problematic for investors whose emotions can get the best of them.


Guidance for Those who are Worried

If you are prone to worry about your investments, there are several actions to consider. First, consider looking at your investments less often. This does not mean a “head in the sand” approach. Instead, if you are looking at your portfolio a few times per day, consider a few times per week. Or, if it’s weekly, consider checking in on your accounts monthly. Second, look at history for context surrounding the volatility. What you will find is that the market, on average, experiences a 14% intra-year drops since 1980. This may not provide you all the peace you want , but having perspective on what is normal can be helpful in curbing emotions. To further combat mixing emotions with investments, read “How to Avoid the Investing Cycle of Emotions” by our own Will Kellar, CFP®. Finally, if the volatility is cause for sleepless nights, you may be someone that needs to take less risk, meaning a conversation with your advisor is warranted.

Because the course of this inflationary cycle is unknown, it is essential for all investors to track their spending to determine what impact inflation has had on budgets. For some, there is plenty of discretionary capital to absorb the increase prices; however, for others, it may be necessary to tighten the belt and prioritize essential spending, to minimize the impact of elevated costs.

[1] U.S. Inflation Calculator

[2] History of Mortgage Interest Rates

[3] Fama, E. F., & Schwert, G. W. (1977). Asset returns and inflation. Journal of financial economics, 5(2), 115-146.

[4] Crawford, G., Liew, J. K. S., & Marks, A. (2013). Investing Under Inflation Risk. The Journal of Portfolio Management, 39(3), 123-135.


If you have feedback for us, have questions, or would like to hear more on other topics we’ve not already covered, please email us directly at hi@humaninvesting.com. We cherish the emails and questions and look forward to connecting with you soon.


Related Articles

Investing 101: How Dividends Work
 

A dividend is when a publicly listed company pays out a portion of earnings to shareholders. These can be paid out in cash or given as additional stock. These are given out to reward investors for entrusting their money with the company.

Who Determines the Dividend?

The Board of Directors decides two things:

  1. If they are going to issue a dividend or invest the profits back into the company

  2. The amount of the dividend

So, how does the Board make these decisions?

Whether or not a company issues dividends to shareholders often depends on how long the company has been around. Companies like Coca-Cola who have been around for a long time have lower growth potential and tend to pay a higher dividend because they see it as the best return for shareholders. If the Board of Directors thinks investing their earnings back into the development of the business will provide a greater return long term, they are most likely going to forego paying out a dividend or increase an existing one.

Many companies, especially newer companies, do not issue dividends. They retain earnings to help with future business activities. See the example below.

Important Dates to Note

These four dates are important to know if you qualify for a dividend and when you will receive it for owning shares of a company.

  1. Announcement date or declaration date: This is when the Board of Directors announces its intention to pay out a dividend.

  2. Ex-Dividend date: The ex-dividend date is the trading date on which the dividend will not be owed to a new buyer of the stock, this is one business day before the record date.

    For example: If the stock has an ex-dividend date of June 26th you will only receive the dividend if you purchased the stock before the 26th of June. If you bought the stock on the ex-dividend date or after you will not receive the dividend this time around.

  3. Record Date: This is the day on which the company checks its records to identify shareholders of the company.

    Note: If you own shares of the company on its record date and sell your shares after the date you will still receive the dividend for that period. If you want the dividend you need to make sure you purchase the stock at least two business days before the record date.

  4. Payment Date: This is the date the company issues the dividend and shareholders are paid out. Companies can pay dividends on a monthly, quarterly, or annual basis.

How Does the Dividend Affect Share Price?

When a company declares a dividend, the price tends to incorporate that dividend into the stock price. The day of the ex-dividend date is the day when the stock price is affected most by the dividend. Since new buyers of the stock will not receive the dividend the price of the stock typically drops by the dividend amount. This is because the dividend is locked into being received by the shareholders as of the previous market close, instead of the new buyers.

How to Receive your Dividend

To receive a dividend for owning shares of a company you must own the shares before the ex-dividend date. If you plan on buying the stock before the ex-dividend date, ensure you place the buy two business days before the record date so that trades have fully settled.

How are Dividends Taxed?

In the tax world there are two types of dividends: qualified and non-qualified.

Most dividends received will be qualified dividends where they will taxed at capital gain rates and receive preferential tax treatment. However, there are a few instances where dividends can be non-qualified and taxed as ordinary income. Such as the examples below.

  • Dividends paid out by REITs (Real Estate Investment Trusts)

  • Dividends paid on employee stock options

  • Dividends paid by tax exempt organization.

  • Dividends paid out by credit union, loan associations, insurance companies, mutual savings banks

Dividends are a Great Perk for Owning Stocks

Investing in companies that pay a strong dividend can be a good way to receive a return on your investment as they pay out cash on a monthly, quarterly, or annual basis. Keep an eye out for companies where the dividend isn’t sustainable based on profits. Lastly, make sure to know how your dividends are going to be taxed so you don’t have any surprises when tax time comes around.


Related Articles

Are Series I Bonds right for you to hedge against inflation?
 

There has been a lot of news on high inflation coming and its looming effects on everything from investment portfolios to the price of milk.

As people are searching for ways to combat high inflation and preserve how far their money can go, we’ve been receiving many questions on an investment option called I Bonds. Questions about what they are and why they haven’t heard of them before.

Our hope is to shed some light on Series I Savings Bonds (I Bonds), available here, and outline how the investment works before offering our recommendations.

How risky is an I Bond?

I Bonds are US treasury bonds, meaning they are backed by the full faith and credit of the US government, making them one of the safest, lowest risk investments possible.

What is the interest rate on an I Bond?

There are two parts to the interest rate on an I Bond.

  • A nominal (fixed) rate — currently 0% as of November 2, 2021.

  • An inflation (floating or adjustable) rate that changes every 6 months — currently 3.56% as of November 1, 2021.

These two rates are added together to determine the interest rate on an I Bond, so the current rate on the I Bonds for 6 months is 0% (nominal) + 3.56% (inflation) = 3.56% total (which is 7.12% annually). This interest rate cannot drop below 0% even if there is ever a negative inflation adjustment. See here for historical I Bond interest rates.

The floating rate on I Bonds will adjust as inflation adjusts. Today, inflation rates are high, but as the historical rates table in the link above shows, inflation rates can be lower.

When can I access my money?

An important factor to consider is that I Bonds only pay interest upon maturity, so you will not receive cash flows from the I Bond as you hold it.

I bonds have no secondary market, so you cannot resell your I Bond, you can only redeem it. I Bonds have no liquidity for the first year after purchase, so it’s important that you will not need to access the funds for at least one year. For years 1-5 after purchase, you may redeem your I Bond early by forfeiting the last 3 months of interest. After 5 years, you may redeem the bond early without penalty. I Bonds will mature 30 years after purchase.

How do the taxes work?

I Bonds only pay interest upon maturity. You can claim (pay) the taxes on the earned interest every year on your I Bonds, or you can pay taxes on all interest upon maturity of the I Bond. I Bond interest is not subject to state or local taxes. See here for more information.

How do I purchase I Bonds?

You have to purchase I Bonds directly through treasurydirect.gov, or with your federal income tax refund. See here for more information.

You are limited to $10,000 of I Bonds through electronic purchase, and $5,000 of I Bonds through paper purchase via your tax refund, for a total limit of $15,000 of I Bonds in a calendar year.

The pros and cons of waiting to get paid out

If you’re still wondering if these bonds are right for you and your financial plan, weigh the pros and cons below against your goals.

Pros:

  • The inflation adjustment makes I Bonds a great inflation hedge

Cons:

  • Interest is only paid out upon maturity, so don’t utilize I Bonds as a source of cash flows over time

  • Funds are locked up for 1 year, so don’t use I Bonds for any funds you might need before then

Other considerations:

  • I Bonds must be purchased on your own, so they’re for a more DIY inclined investor

  • The inflation adjustment rate will change adjust over time, so the precise amount of interest an I Bond will earn is uncertain

  • Consider the potential taxes of having all interest hitting upon maturity of the I Bond, or having to pay taxes each year on interest you have not yet received

  • You are limited on how much you can purchase in a year

I Bonds are typically best for medium term (i.e. around 5 year) savings goals.
The inflation adjustment reduces your risk of losing purchasing power due to inflation. The low nominal rates on I Bonds today means your funds will not grow faster than inflation.

For longer term savings goals (i.e. retirement in 10+ years), equities are a great long-term inflation hedge, because companies can adjust their prices (and therefore dividends & earnings) based on inflation. Treasury Inflation Protected Securities (TIPS) are another, lower risk than equities, investment that adjust for inflation.

If you have more questions about I Bonds, or would like to speak to a financial professional about other investments, please reach out to us at hi@humaninvesting.com or 503-905-3100.


Related Articles

The Real Risk of Owning Bonds: Too Much in Bonds May Hurt Your Purchasing Power
 

We talk to a lot of different people about investing. A common request is something along the lines of: “I don’t want to lose anything, and I want my money to grow.” This is a challenging, if not impossible mission. The investment world is full of opportunities to grow your money. However, there is an inherent risk when you put your money in any investment.

Finance has a lot of ways of measuring risk. Standard deviation is used to try to show a range of the possible returns. Max drawdown displays your worst-case scenario. Sharpe ratio provides a risk-adjusted measure of performance. However, very few investors ask about standard deviation, max drawdown, and Sharpe ratios. The people we talk to are most likely to ask “What are the odds of losing money” because they don’t want to see their current savings drop in value.

How strong is your purchasing power?

An important consideration when talking about losing money is purchasing power: the ability to buy goods with your money. Inflation has consistently pushed prices up over time, reducing the purchasing power of a single dollar. Wanting to avoid losing money is completely understandable. The danger of keeping your money under your mattress or sitting in cash is that inflation is constantly reducing your purchasing power.

When concerned with losing money, many investors are focused on nominal returns. Nominal returns are the raw return values, unadjusted for inflation, and are simple to calculate and digest. I would argue that most investors should be focused on real returns: returns adjusted for inflation. Real returns are a more accurate measure of your change in purchasing power. Ultimately, very few outside of Scrooge McDuck want a giant pile of money. Most people want to spend that money on goods, like food, travel, or a home, therefore purchasing power is likely what investors really care about.

Real return = (1+Nominal Return) ÷ (1+inflation rate)

Historically, stocks deliver positive returns, and those returns are in your favor. However, stocks are down (i.e. lose money) more frequently than bonds. The safety bonds offer also means they provide lower returns. What blend of stocks and bonds is most likely to protect your purchasing power (i.e. produce a positive real return)?

inflation is dwindling BOND power

To try and answer this question, I looked at the Stocks, Bonds, Bills, and Inflation (SBBI) data from the CFA Institute from 1926-2020. This data included monthly and annual returns; the annual data is for each calendar year. For stocks, I used the Ibbotson SBBI US Large-Cap Stocks total return.

For Bonds, I used the Ibbotson US intermediate-term (5 year) Government Bonds total return. I looked at several different portfolios which include a variety of stocks and bonds. Specifically, I blended the stocks and bonds in 10% increments, from 100% stocks, to 90% stocks 10% bonds, to 80% stocks 20% bonds, and so on to 0% stocks 100% bonds. I also assumed the portfolios were rebalanced at the start of each return period (i.e. the weights were reset at the start of each month for monthly data, and the start of each calendar year for annual data).

I took these different stock/bond portfolio mixes, and I calculated the nominal and real returns from 1926-2020 for both monthly and annual (calendar year) returns. I then calculated what percentage of returns were positive to measure the chance of losing money (nominal returns) or purchasing power (real returns). I’ve graphed the nominal vs real returns for monthly and annual returns below.

bonds-monthly-returns.jpg
bonds-annual-returns-v2.jpg

You’ll notice the nominal monthly returns paint a clear picture. If you want positive nominal returns more often, you want to own more bonds, hence the steady upward trend to the graph. If you look at the annual nominal returns and want to maximize your chances of a positive nominal return, you actually want a 10/90 portfolio (10% stocks, 90% bonds). As risky as stocks seem, having at least a sliver of stocks actually increases the chances of a positive nominal return

The real returns tell a slightly different story. For the monthly real returns, the stock/bond mix is almost irrelevant for producing a positive return, and hovers right around 60%. There is a drop off after 10/90 (10% stocks, 90% bonds), indicating owning even just 10% stocks in your portfolio helps increase your chances of positive real returns better than owning 100% bonds.

For the annual real returns, you can see that your odds of a positive real return are better with at least some bonds in the portfolio. Interestingly, the 70/30 portfolio and the 20/80 portfolios produce the highest chance of a positive real return. The all bond portfolio, 0/100, has the worst chance of maintaining your purchasing power (i.e. producing a positive real return).

Stocks can seem risky, and the loss of value can make many investors shy away. Even just a small amount of stocks can protect your purchasing power better than owning only bonds. There are still many considerations for how you should invest including your risk tolerance, time horizon, and holistic financial plan. If you’re interested in talking to an advisor, please reach out to us at hi@humaninvesting.com or 503-905-3100.


Related articles

How to Maximize your Nike Stock Options
 

For many years, Stock Options have been a foundational part of compensation for Nike leaders.  They have provided a unique opportunity to build significant wealth by participating in the success of Nike.  While Stock Options can have a great impact on your financial landscape, they can also create considerable confusion. In our experience working with Nike leaders, we have found that there are often misunderstandings about Stock Options and how they differ from actual shares of Nike stock. While we are responsible for the financial planning intricacies for our Nike clients, we wanted to provide a background on Stock Options and share the most important factors to fully maximize them.  

What are Nike Stock Options and how do they work?

Nike Stock options are the right to purchase shares of Nike at a set price (exercise or strike price) that lasts for up to 10 years.  I like to think of them as “coupons”, where you can use your coupon to buy an item for a price that is lower than it is currently worth.  Once you have used your coupon, you could proceed to immediately sell that item for the current price, capitalizing on the difference between the coupon price and the current market value.

Value of Stock Option = # of Options x (Current Stock Price - Exercise Price

To illustrate the difference between stock and Stock Options, it only seemed appropriate to use a shoe analogy.  Imagine you are given access to Limited Release Jordan shoes, and you have two different choices to select from:

nike-stock-choice-1.jpg

So which choice is better for you?  It depends on what happens to the value of those Jordans in the future.  Will the value increase or decrease and by how much?  Do you need another pair of Jordans today? Or can you wait until the future to use them? To better understand how it can all play out, we put the 2 Choices against each other in three head-to-head matchups to determine the winner in each situation.


ROUND #1: Value of SHOES drops -10% to $900. 

Shoe Choice: you are still left with shoes that you could sell for $900 or keep if you think the value could recover and grow further.

Coupon Choice: your 10 coupons are worthless since there is no value in purchasing shoes for more than they are worth at $1,000 per pair.

WINNER: Shoe Choice

ROUND #2: Value of shoes increases +10% to $1,100

Shoe Choice: your shoes are now worth $1,100 and the value has increased by $100.  You can sell them or keep them if you think the value could continue to increase further.

Coupon Choice: your coupons would allow you to purchase 10 pairs of shoes for $10,000 (10 coupons x $1,000 per pair).  You could them resell them for $11,000 (10 pairs x $1,100 per pair) and earn a profit of $1,000 ($11,000 value - $10,000 purchase cost).

WINNER: Shoe Choice

ROUND #3: Value of the shoes increases +50% to $1,500

Shoe Choice: your shoes are now worth $1,500 and the value has increased by $500.  You can sell them or keep them if you think the value could continue to increase further.

Coupon Choice: your coupons would allow you to purchase 10 pairs of shoes for $10,000 (10 coupons x $100 per pair).  You could them resell them for $15,000 (10 pairs x $1,500 per pair) and earn a profit of $5,000 ($15,000 value - $10,000 purchase cost).

WINNER: Coupon Choice


THE POST MATCH ANALYSIS

nike-scorecard.jpg

Round #1: Shoe Choice (Nike Stock) won and underscores the risk of Stock Options and how the value can become $0 if the stock price does not increase. 

Round #2: Shoe Choice (Nike Stock) won but only by a small amount.  Even if the stock grows, low growth still favors Nike Stock over Stock Options. This is common if Stock Options are held for a short period of time. 

Round #3: Coupon Choice (Stock Options) won by a significant amount.  Substantial growth in Nike stock will favor Stock Options by a wide margin. 

UNDERSTANDING THE OPPORTUNITY AND RISK

The Shoe & Coupon Choices shows how the Stock Options can perform from the beginning, but what about Stock Options that you already own and have existing value?  At Human Investing, we created a Stock Option Volatility Analysis to show what the upside and downside volatility can be like for existing Stock Options.

nike-volatility.jpg

If you examine the outlined bars, you will note that a 15% increase in Nike Stock price would result in a 101% increase in the value of that Stock Option. At the same time, a 15% decrease would drop this Stock Option value by -101%.  The owner of Nike Stock Options should be prepared and ready to experience significant short-term declines like the ones shown in the chart above.

The key to capturing the upside potential of Nike Stock Options is having a long enough time horizon.  Stock prices can quickly move up and down in the short-term but have a history of growth over the long-term (10+ years).  If you own Stock Options and can wait long enough before you exercise and sell them, that will give you the best probability of maximizing the value.

WHAT HAPPENS WHEN YOU LEAVE NIKE?

Since a longer time horizon is one of the most important components for success with Stock Options, what can disrupt that opportunity?

If you leave (voluntarily or involuntarily) Nike, you typically have up to 90 days to exercise your vested stock options and all unvested stock options are forfeited.  While it is uncommon, there have been some exceptions where the 90-day time period is extended.

In addition, if you meet specific “retirement” criteria, you can receive more favorable vesting for your unvested options.  There are two “retirement” benefits that are unique to Nike stock options:

1) Early Retirement: Age 55-59 with 5 years of Service

  • Unvested Stock Options (less than one year prior to separation) will be forfeited. 

  • All other unvested Stock Options will continue per the original vesting schedule.

  • After your retirement date, you will have up to 4 years to exercise your options. 

2) Normal Retirement: Age 60+ with 5 years of Service

  • Unvested Stock Options (less than one year prior to separation) will be forfeited. 

  • All other unvested Stock Options will become fully vested as of the retirement date.

  • After your retirement date, you will have up to 4 years to exercise your options.

The special retirement vesting options described above can be an extremely valuable benefit to plan for and take advantage of if you are close to or at age 55+.

HOW ARE STOCK OPTIONS TAXED?

As Stock Options vest and grow in value, there is no tax along the way.  Tax is only recognized when you exercise your options.  The dollars are taxed in the same way as your salary, at ordinary income tax rates, which can be as high as 55.45% since it includes federal, state, Social Security, and Medicare taxes.  This can push you into a higher income tax bracket and often disrupts your tax liability if not adequately planned for throughout the year. 

TAX & PLANNING STRATEGIES

Strategy #1 – Spread Option Exercises Over Multiple Years

Since exercising Stock Options creates additional taxable income, carefully exercising the right amount and dividing it over more than one year can help you lower your overall taxes. 

For example, assume you have taxable income is $450,000 and have $350,000 of Stock Options that you want to exercise. Your current income of $450,000 would be in the 35% tax bracket (2021) and you will not move up to the 37% tax bracket until your income exceeds $628,301 (2021).  That leaves room for $178,301 worth of stock exercises that would be taxed at 35% before it reaches the 37% bracket.  If you spread the $350,000 of exercises over two years ($175,000 per year) instead of exercising the entire amount in one year, you could avoid the 37% bracket and save about $3,500 in Federal taxes.

Strategy #2 – Coordinate Option Exercises with the Nike Deferred Compensation Plan

Another strategy is to coordinate the timing of your Stock Option exercise with the contribution of a similar amount of salary and/or bonus into the Nike Deferred Compensation plan.  This strategy requires the following steps:

  • Step 1: Determine the amount of Stock Options you wish to exercise. As an example, we picked $300,000 of stock options to exercise.

  • Step 2: Elect to defer the same amount ($300,000) into the Nike Deferred Compensation plan from your salary during Open Enrollment.

  • Step 3: Exercise and sell $300,000 of Stock Options in the same tax year as you are contributing $300,000 to the Nike Deferred Compensation Plan

  • Step 4: Use the proceeds from the $300,000 of Stock Option exercises to replace your salary and support your living needs.
    In the end, you would have essentially funneled your Stock Option proceeds into the Deferred Compensation plan and avoided paying any additional taxes. 

Learn more about the Nike Deferred Compensation Plan.   

Nike stock options are an incredible opportunity

Although Nike Stock Options are often misunderstood, they can provide an incredible opportunity to generate wealth.  To really maximize of the opportunity, we recommend that you are prepared to navigate the volatility, complexities, and tax strategy. 

If you have any questions or want to know more about how to handle your Nike Stock Options, please get in touch.

You can schedule time with me on Calendly below, e-mail me at marc@humanvesting.com, or call or text me at (503) 608-2968.


Related Articles

Kickstarting Your Financial Plan
 
unsplash-image-PVIbUkN_wCQ.jpg

Not sure what questions to ask when you meet with an advisor?

Here are six questions we commonly get asked with some advice from our team.

1. I want to support my child through college. When should I start saving?

The earlier you save, the more time your money has to grow.

rivermark-01.jpg

The benefits of saving early are dramatic, but there's still value in starting now—even if your child is in high school. The dollars you save will not have as much time to grow, but they are dollars you will not be borrowing. You’ll also be in a better situation if you choose an account that gives you tax benefits, such as immediate tax deductions or tax-free withdrawals.

Still not sure if saving for college is right for you? Check out this article by Peter Fisher, co-founder and managing partner of Human Investing.

2. Should I spend my cash paying off high interest loans, or invest it?

Historically, the average rate of return for stock market investments is approximately 10%, while on average, the APR on credit cards has been hovering just above 20%. So, if you are investing when you have credit card debt, you are likely paying a higher interest rate on your debt than you are earning via your investments. Unless you have a huge amount in investments, you end up losing money overall.

3. When do I start saving for retirement?

Again, start saving as early as possible to give your money maximum time to grow. Depending on your employer, you may already have some form of retirement benefits accruing. There are various ways of saving for retirement, including employer sponsored plans like 401(k) and 457b plans, or personal retirement savings like Roth and Traditional IRA’s. A mix of the two is the best way to ensure ample savings for retirement, but deciding which is best for you requires some analysis of your current and expected employment and income status.

4. Is my investment portfolio right for me?

As you age and get closer to retirement, you want to make sure the risk level of your investment portfolio is balanced to match your growth and maintenance needs. While having all of your investments allocated in the stock market may result in a high return on investment, it can also result in high losses. This can be catastrophic for a person planning on retiring soon. On the other hand, if a young person has a few decades before they are planning to retire, but they are only investing their money in bonds, they are losing out on the potential growth of higher risk investment options.

 Investment in both bonds and stocks allows for a mix of potential income and growth, and the best fitting ratio is different for everyone. Reach out to us to speak with our retirement planning team to discuss your current allocations. We care here to help better prepare you for a comfortable retirement.

5. What should my emergency savings look like?

The most common numbers suggested for an emergency fund is 3-6 months’ worth of your current living expenses. These include expenses such as housing, food, healthcare, debts, and so on. You do not need to include things like entertainment, nonessential shopping, or vacation expenses. If you are, you have too much going into your emergency savings fund that could be invested elsewhere. Below is a chart showing example savings amounts and how they compound over the course of two years.  

6. When should I begin utilizing expert tax services?

You may be at a point where using your preferred e-file service to do your taxes is still getting the job done just fine, but at what point do they get too complicated for you to be doing them on your own? Once you begin to deal with things like property taxes, retirement plans, and investments, it may be best to have an expert handle the numbers for you.

Luke Schultz, the Director of Tax at Human Investing, has over 12 years of experience in the areas of tax compliance and planning. With a heavy focus on planning, he spends much of his time working closely with individuals, putting emphasis on proactive planning to help clients make the best decisions for them and their families.

Want to get started?

Schedule an appointment with an advisor here or feel free to call us at 503-905-3108.

Sources:
Vanguard, When should you start saving for college?
The Balance, Rule of Thumb: Should I Pay Off Debt or Invest?
Money Under 30, Should You Pay Off Student Loans Early?


Related Articles

Hoping for a Nike Stock Split? Why a Stock Split should not change your investment strategy.
 

The recent success of Nike stock has begun to fuel questions and curiosity about a future stock split.   When a company like Nike announces a stock split, does it lead to an immediate increase in value?  For many investors, stock splits tend to generate enthusiasm and an expectation that the stock will experience significant growth but is that always the case?  We will review what a stock split is and why companies have them.  Applying it specifically to Nike, we will explore the history of Nike stock splits and how the stock performed after those splits occurred.  

What is a Stock Split? 

A stock split happens when a company divides its outstanding shares into multiple shares, increasing the overall number of shares.  Since the underlying value of the company does not change, this results in a lower price per share.  For example, if you own 50 shares of Nike and the stock price was $100/share, your total value would be $5,000.  If Nike completed a 2-for-1 stock split, you would then own 100 shares with a stock price of $50/share, resulting in the same $5,000 total value.   

Why Do Companies do Stock Splits? could it increase the value of the stock?  

Companies have historically performed stock splits to make the stock more liquid and accessible to owners.  Stock splits typically occur after a company has experienced significant growth and the higher price may become a barrier to the average investor.  In the example above, you would need $100 to purchase one share of Nike before the stock split.  After the 2-for-1 stock split, you would only need $50 to purchase a share of Nike.

In theory, a stock split should not change your total dollar value in the stock.  However, the announcement of a stock split can create renewed interest and availability in the stock, which can result in a temporary price increase.  How has the announcement of a stock split affected Nike stock historically?   

History of Nike Stock Splits

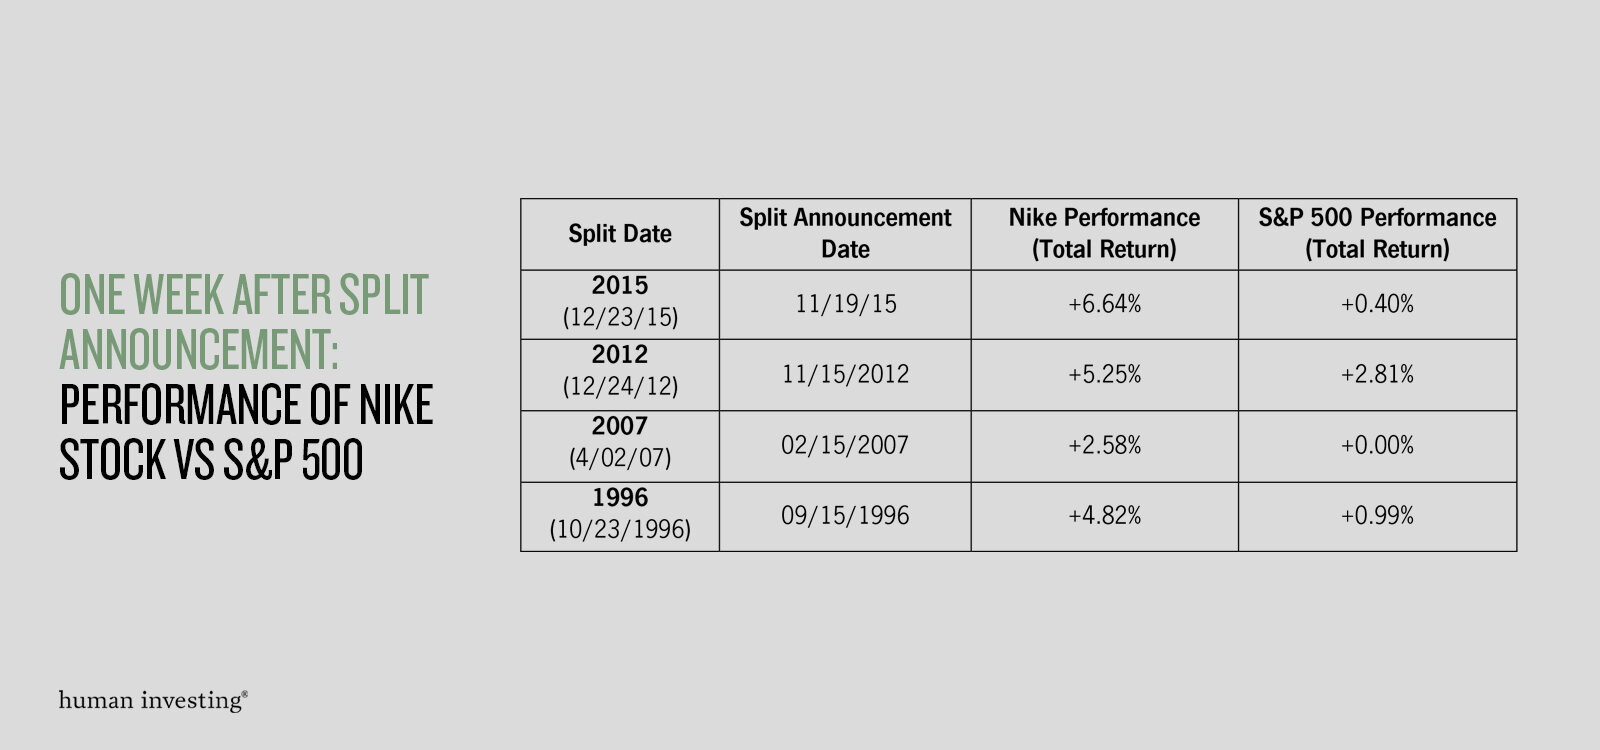
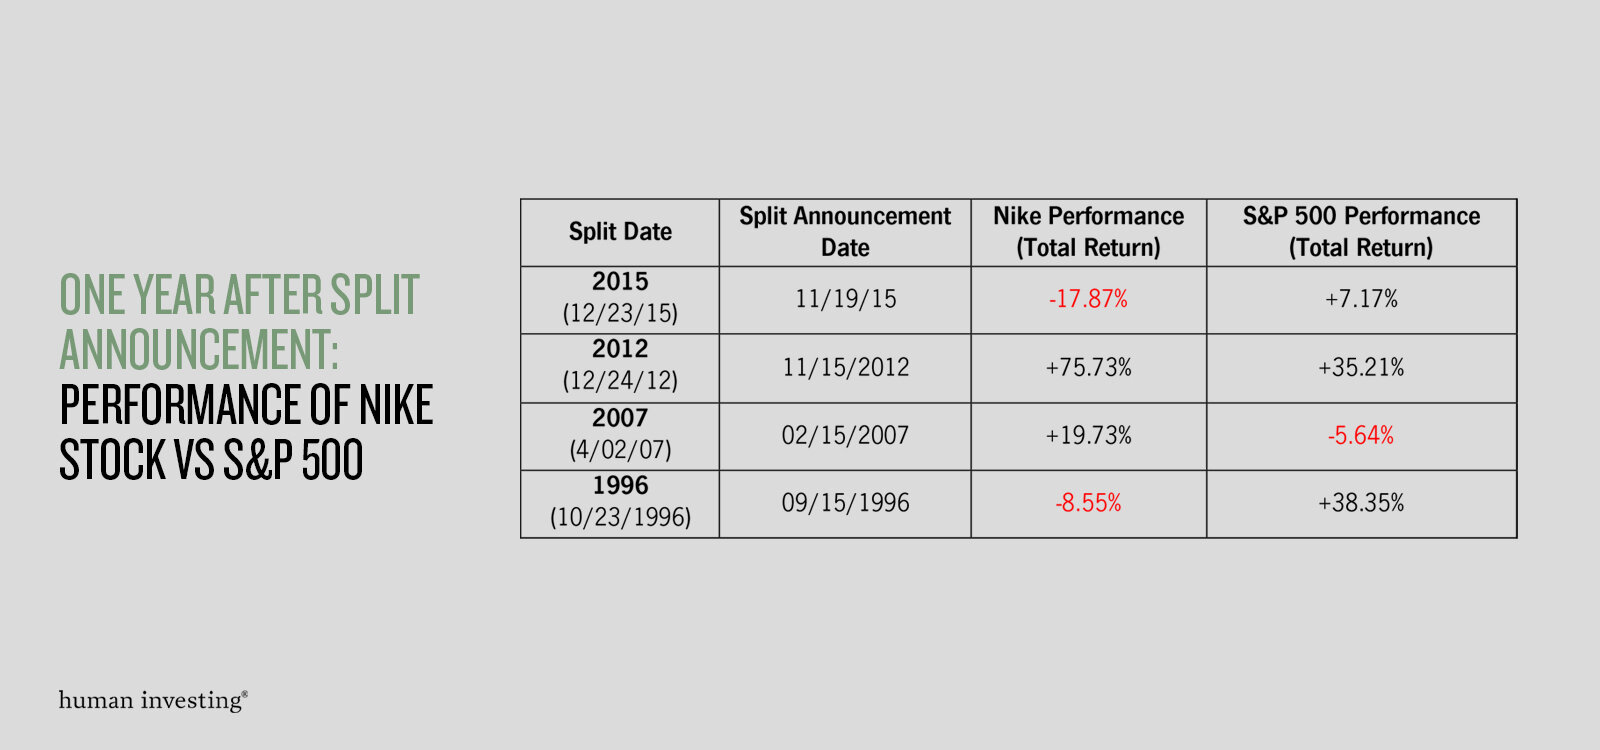
Nike has performed a 2-FOR-1 stock split seven times in its history, with the first one occurring in 1983 and the most recent one occurring in 2015.  We examined the performance of Nike stock compared to the S&P 500 Index (benchmark for US Large Cap Stock Market) both 1 week and 1 year after the announcement of the last four stock splits in 1996, 2007, 2012 and 2015.

nike-split-01.jpg
nike-split-02.jpg

Observations of Last Four Nike Stock Splits

When observing the outcomes of the last four Nike stock splits, several points stand out.

  1. Initial Price Bump for Nike – In all four cases, there was a solid price increase over a 1-week period after the announcement ranging from 2.5%-6.64%.  This price bump was much higher compared to the S&P 500 performance over that same period.  This is not surprising as a stock split announcement tends to garner interest and is considered favorable for the company.

  2. Lack of Consistency – When you look at the 1-Year return numbers for Nike, there is much more variability in the outcomes.  Although one might assume that there would be positive 1-year performance each time, the stock price was in fact negative in 2 of the 4 years. 

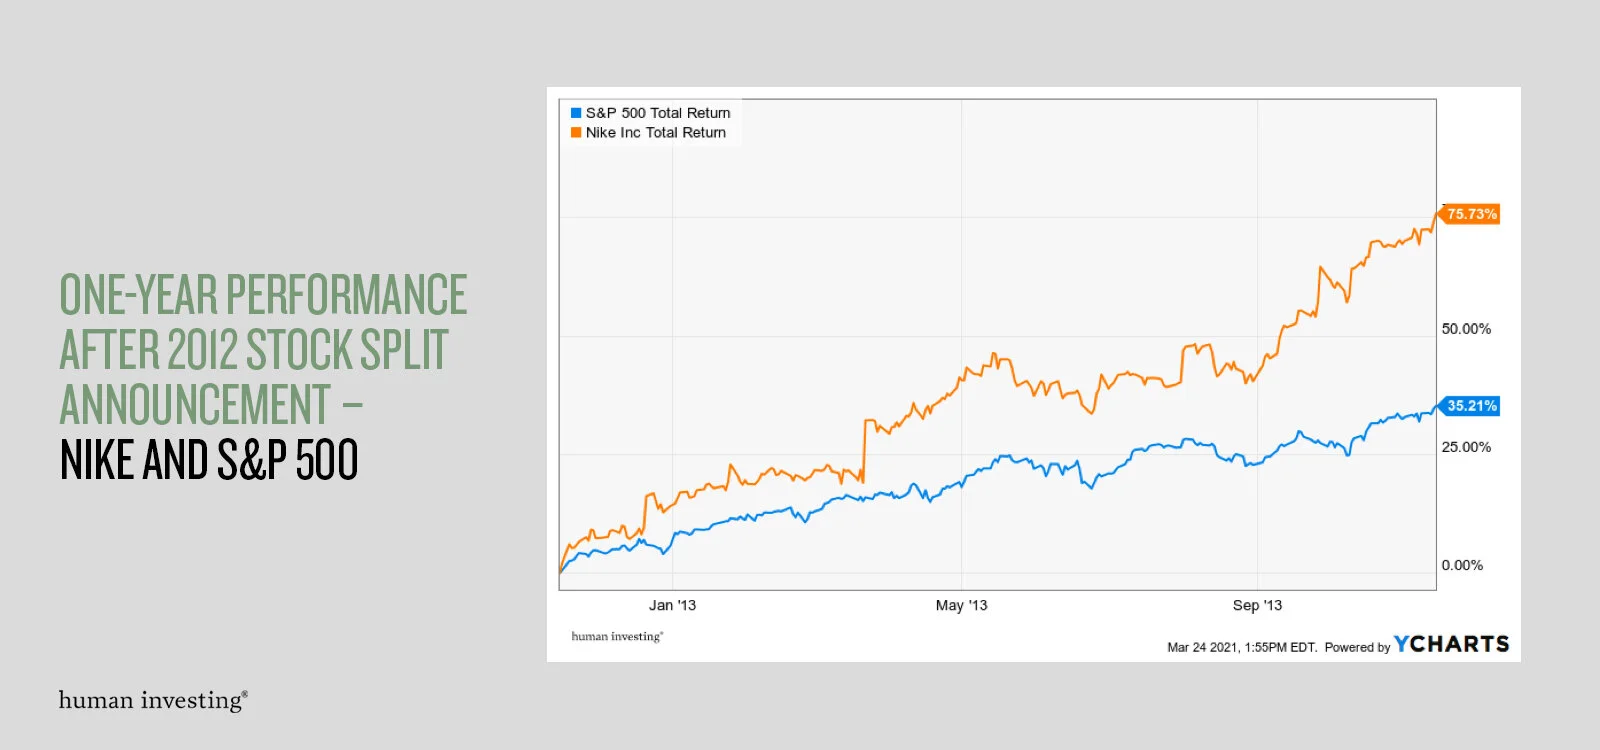
  3. Nike and the S&P 500 were Not on the Same Page – When comparing the 1-year performance between Nike and the S&P 500, in all four instances, the variation in returns was significant and had an average return difference of 34.46%.  For example, in 2012, Nike was up +75.73% versus S&P 500 at +35.21% (40.52% difference) and in 1996 Nike was down -8.55% and S&P 500 was up +35.35% (46.90% difference).

nike-split-03.jpg
nike-split-04.jpg

our recommendation for nike employees

During any short period of time, stock prices can move unpredictably and an event like a stock split does not necessarily result in substantial growth.  Stock splits do not fundamentally create any additional value and as you can see by the last four Nike splits, the results are inconsistent. The historical performance shows that any initial price increases from the split tend to be temporary.  We recommend that owners of Nike stock view their investment as long-term (10+ years), which will provide the best opportunity for success regardless of whether the stock undergoes a split or not.

If you have questions about your Nike stock and how it applies to your situation, please get in touch.

You can schedule time with me on Calendly, e-mail me at marc@humanvesting.com, or call or text me at (503) 608-2968.   


Related Articles

It might be time to Maximize your Intel SERPLUS Deferred Compensation Plan
 

Perhaps now more than ever, it makes sense to increase your deferral to the SERPLUS deferred compensation plan. The following chart compares current tax rates to the proposed tax rates by the new administration.

Web 1920 – 1.png

Though we are uncertain when the tax changes will be implemented, we do know that tax rates will increase. If taxes increase, your deferred compensation benefits may become even more important for your tax planning.

TAP INTO Significant Tax and Income Benefits

Deferred compensation plans provide an opportunity to receive less income today in order to pay less taxes on that income when received in the future. When making annual deferred compensation elections, you have the choice of a 5-year, 10-year, or lump sum payment at retirement (when employment with Intel ends). If you plan to retire at 62, you could elect to receive distributions for 10 years from your SERPLUS plan to stretch out your income and realize it in a lower tax bracket until age 72. With this plan, you have deferred compensation income providing for your first 10 years of retirement. In your early 70’s, social security and required IRA distributions will supplement your steady income stream, and eventually replace your deferred compensation income.  

Spreading deferred compensation income out over 10 years allows you to take it in a lower tax bracket, like 21% for Federal and State combined or 24% combined after 2025. This tax deferral would provide for a tax reduction between 23% and 35%. In a hypothetical scenario, $50,000 contributed per year over 15 years would total $750,000 (without earnings computed). The income deferral could provide $172,500 in tax savings in a conservative example and $262,500 in savings in a more generous example. That is real money in your pocket rather than in the Federal and State governments. 

In the peak earning years of your life, with your 401k maxed out and not providing enough tax deferral and future income, the SERPLUS deferred compensation plan is a great tool to help increase both.

Cash Flow Considerations AND SOLUTIONS

If you do participate in the plan, your current take-home pay will decrease.  If cash flow becomes tight, there are opportunities within your employee benefits that could help provide the needed funds. It may be advisable to sell some company stock (ESPP, RSUs) to supplement your monthly income so that you can participate in the plan and defer income. Keep in mind, your election made in 2020 on salary is for the 2021 income year, whereas the bonus election is for the bonus paid in 2022. A portion of the bonus could be especially important to defer in 2022 considering the proposed tax changes. 

Questions ABOUT YOUR INTEL BENEFITS?

If you have questions about making deferred compensation elections, please schedule a call.


The Importance of Portfolio Rebalancing and Market Timing
 
loic-leray-fCzSfVIQlVY-unsplash.jpg

What a season it has been.  I hope and pray that each individual and family member receiving this note is healthy and safe.  My goal over the coming months is to increase the volume of written communication.  These notes will not replace our regular scheduled tax, planning, or portfolio updates.  Instead, they will supplement those conversations and provide a financial perspective that can be communicated efficiently in writing.  The purpose of this note is to discuss our position on market timing and portfolio rebalancing.

Portfolio Rebalancing

We believe that the financial plan is the seminal document for investors seeking to accomplish long term goals. Each financial plan is prescriptive in the amount of saving and portfolio return that is required to accomplish the goals outlined in the plan.  The asset allocation decision is an important one—given it considers risk tolerance, time horizon, and financial goals[1].

The goal of rebalancing is to minimize risk and recalibrate, rather than to maximize return.  The process of rebalancing takes the imbalance that is created by certain asset classes over time and recalibrates those asset classes.  It takes the asset allocation that was originally prescribed by the financial plan and reorients the portfolio to its intended mix of stocks, bonds, and cash.

For most portfolios, recalibration should occur a few times a year.  This is particularly true in retirement accounts, given there is no tax liability for creating gains.  In trust accounts as well as individual and joint accounts, there is a sensitivity to tax gains as a possible consequence of rebalancing.  Every effort is taken to minimize tax liability in those types of accounts.  However, it can be hazardous to let the concern over taxes negate the discipline of regularly rebalancing.  I can think of too many instances where a client avoided rebalancing their account out of concerns for taxes—only to have the market go down. The tax liability for rebalancing was ultimately dwarfed by the loss of principle due to the market decline.  In short, it is rarely advisable to let the tax tail wag the investment dog.

Market Timing

The most common question I receive is, “when should we sell out?”  My typical response is never.  If an investor has a financial plan, which accounts for planning-based return expectations and subsequent asset allocation, the portfolio should always be properly positioned for risk and return.  If the goal of “selling out” is to reduce risk, the action of selling implies the original allocation was incorrect. 

In the past, there have been a few occasions where dramatically reducing risk by selling equities and raising cash makes sense.  Or, to sell a portion of the stock investment and place the proceeds in bonds.  But those reasons have to do with new information about the client situation, which prompt a change in the asset allocation. As an example, years ago, we had a client let us know that their business was struggling, resulting in the potential that their retirement account would need to be tapped for an emergency.  Liquidating equities in their account was a response to a change of plans and circumstances—this is a plan modification and not market timing. 

There is ample research dating back to the 1980s which suggests timing the market[2] or being able to predict the direction of the market is challenging at best[3].  Therefore, we believe in rebalancing “to recapture the portfolio’s original risk-and-return characteristics”[4], and we rely on the financial plan as the authoritative document to prescribe the proper mix of stocks and bonds for each client we serve.


Sources

[1] Zilbering, Y., Jaconetti, C. M., & Kinniry Jr, F. M. (2015). Best practices for portfolio rebalancing. Valley Forge, Pa.: The Vanguard Group. Vanguard Research PO Box2600, 19482-2600.

[2] Brinson, G. P., Hood, L. R., & Beebower, G. L. (1986). Determinants of portfolio performance. Financial Analysts Journal42(4), 39-44.

[3] Butler, A. W., Grullon, G., & Weston, J. P. (2005). Can managers forecast aggregate market returns?. The Journal of Finance60(2), 963-986. 

[4] Zilbering, Y., Jaconetti, C. M., & Kinniry Jr, F. M. (2015). Best practices for portfolio rebalancing. Valley Forge, Pa.: The Vanguard Group. Vanguard Research PO Box2600, 19482-2600.


Related Articles