The Ultimate Guide to Navigating and Lowering Taxes for Nike Execs and Leaders


A growing complexity

As a Nike leader, you are provided a comprehensive range of benefits that help achieve financial and retirement goals. The downside is that these benefits often create confusing tax implications. Multiple measures over the last few years have passed to increase taxes on high-income earners, including the Metro and Multnomah County taxes. These tax measures in addition to regular Federal and Oregon taxes are becoming an increasing burden for Nike executives. 

A clear understanding of the tax implications with these benefits is crucial. Employing appropriate strategies can both reduce your tax burden and also prevent any surprises during tax season in April.

Let’s examine the three biggest reasons you could get hit with a tax bill and review a recommended solution.

The 3 leading causes to tax surprises

1. Wrong tax withholding on supplemental pay

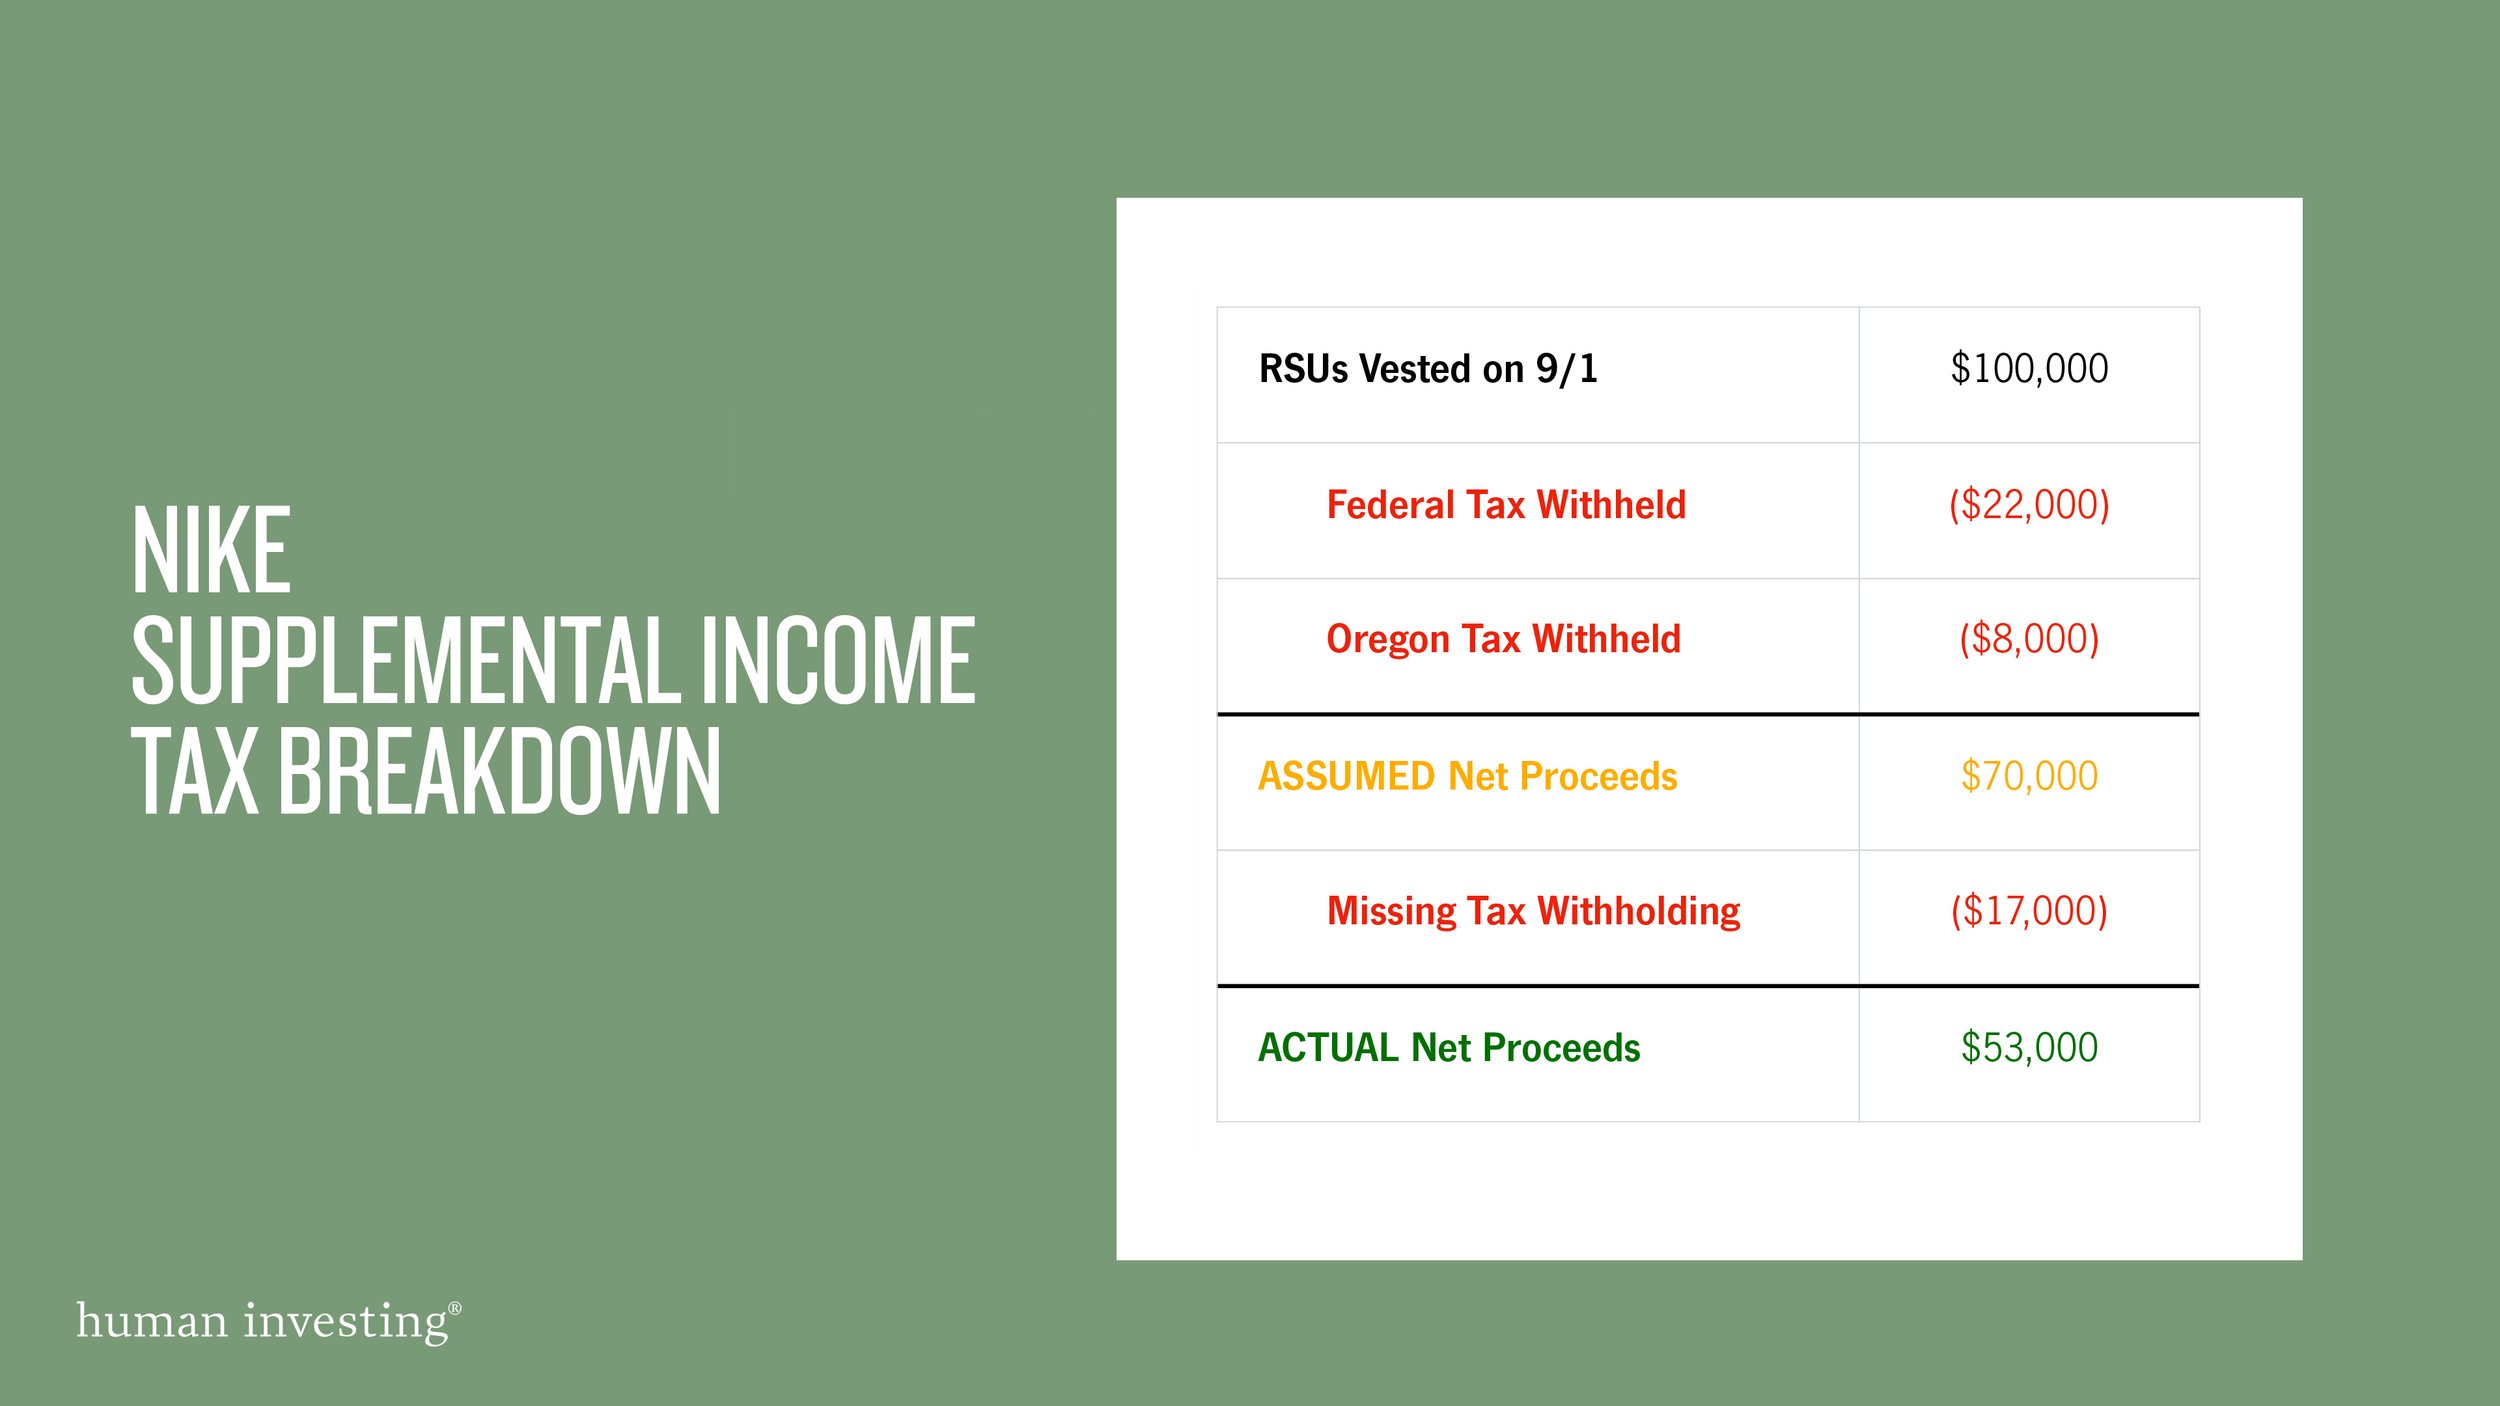
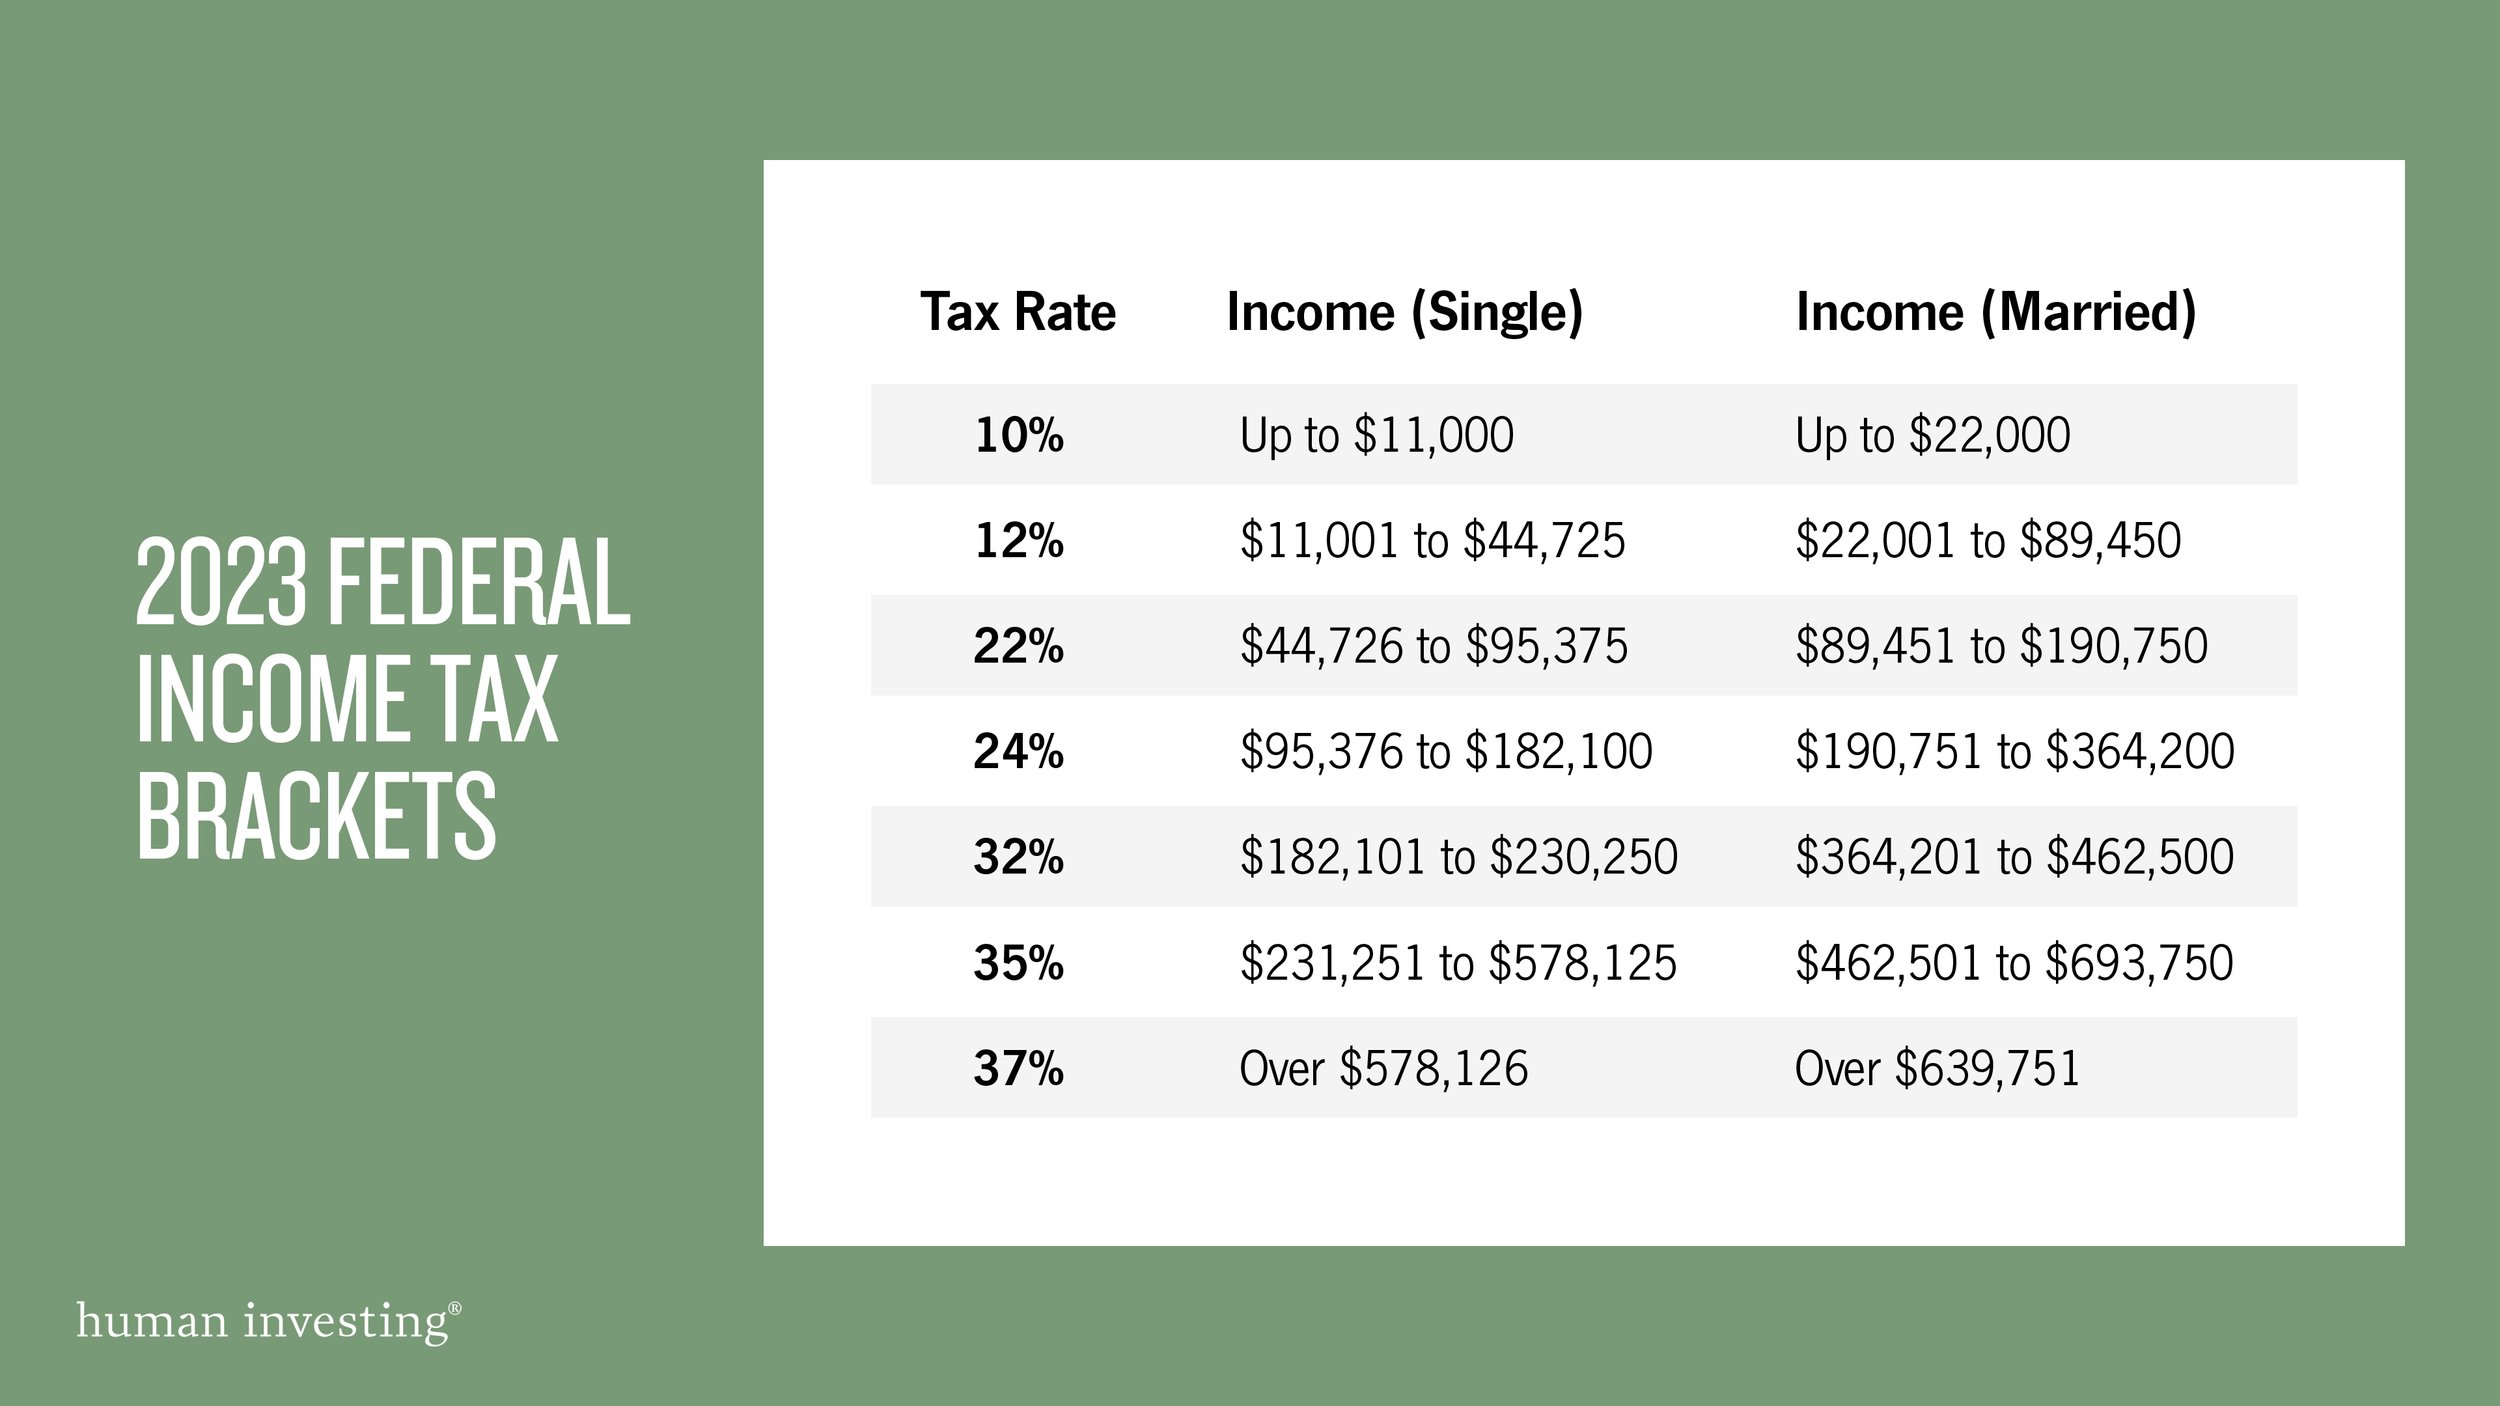
Many compensation sources at Nike beyond salary (such as PSP, LTIP/PSU vests, RSU vests, and stock option exercises) are taxed as “supplemental pay,” which come with a set percentage of tax withholding (22% Federal + 8% Oregon) regardless of your tax bracket or tax withholding elections on your salary. The reality is most Nike executives are in a much higher income tax bracket, sometimes as much as 17% higher than the amount withheld. This discrepancy leaves a significant gap in the amount taxes that should have been withheld versus the actual amount.

For example, Kate Executive has $100K of RSUs that vested on September 1st. With all her income sources (salary, PSP, LTIP/PSU, RSUs) her taxable income is $700K. The taxes automatically withheld on the $100K RSU vests would be about $30K (22% Federal + 8% State).  However, based on her tax bracket, Kate will owe another $17,000 on that RSU vest.

2. No tax withholding for Multnomah County’s “Preschool for All” tax

For those who live in Multnomah County, you are likely subject to the “Preschool for All” tax that started in 2021. Unfortunately, Nike does not withhold taxes from payroll to cover this tax, so you will be responsible to fully cover this on your own. Multnomah County expects these payments to be received quarterly to avoid interest and penalties.

The Preschool for All tax is 1.5% on taxable income over $125,000 for individuals and $200,000 for joint filers, with an additional 1.5% on taxable income over $250,000 for individuals and $400,000 for joint filers. The rate will increase by 0.8% in 2026.

3. No coordination of Portland Metro tax payments for 2 working spouses

Since Nike headquarters is located within the Portland Metro, they do withhold taxes for the Metro Supportive Housing tax (a.k.a. Homeless tax) that also started in 2021. The Metro Supportive Housing Tax is a 1% tax that is applied on income over $125,000 single filer or $200,000 joint filer. 

A common issue arises when you have two working spouses at different companies, since the income threshold for this tax is based on household income and the two different employers obviously do not communicate with each other.   

For example, once a Nike executive’s income reaches $200K, Nike will start to withhold the Metro tax on any income above that amount. However, the other spouse’s employer does not know about the income at Nike and assumes that the spouse’s income is the household income. So, if that spouse earns $90K, no Metro tax is withheld on that amount even though all of it is subject to the Metro tax.

The 3 tax payment issues identified above often lead to a frustrating situation, where you either end up with a significant tax bill in April or you have been paying in the wrong quarterly estimated tax payment amounts given to you by your CPA.

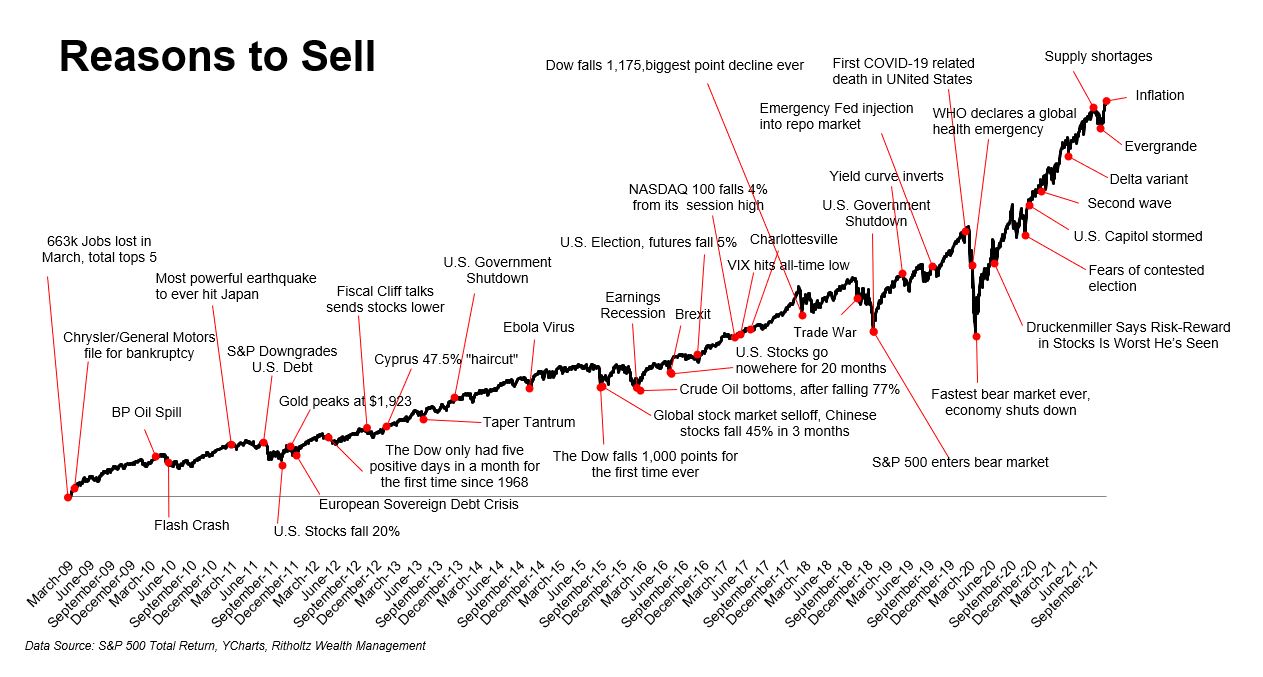
Our recommended solution: The pay as you receive strategy

For many Nike executives, setting aside additional tax payments into your monthly household cash flow can become stressful, since the amounts can be so inconsistent.   

The “Pay as You Receive” strategy is calculating the estimated amount of taxes due from each type of “Bonus Compensation” as you receive it and making those tax payments at that time, while you have the funds to do it. This will leave your monthly cash flow separate and unaffected.

If this sounds like a lot of work, you can make it simpler by applying this method during 2 key time periods. 

  • Time Period #1: August – PSP, LTIP/PSU bonus’

  • Time Period #2: Early September: September 1st RSU vests

A more thorough approach is the also include any February retention RSU vests and stock option exercises as they occur.

These supplemental estimated tax payments, when combined with the withholding, should be equal to your anticipated tax bracket for the calendar year. This approach helps ensure that your total payment to the IRS, Oregon, Multnomah County, and Metro aligns with your tax obligations.

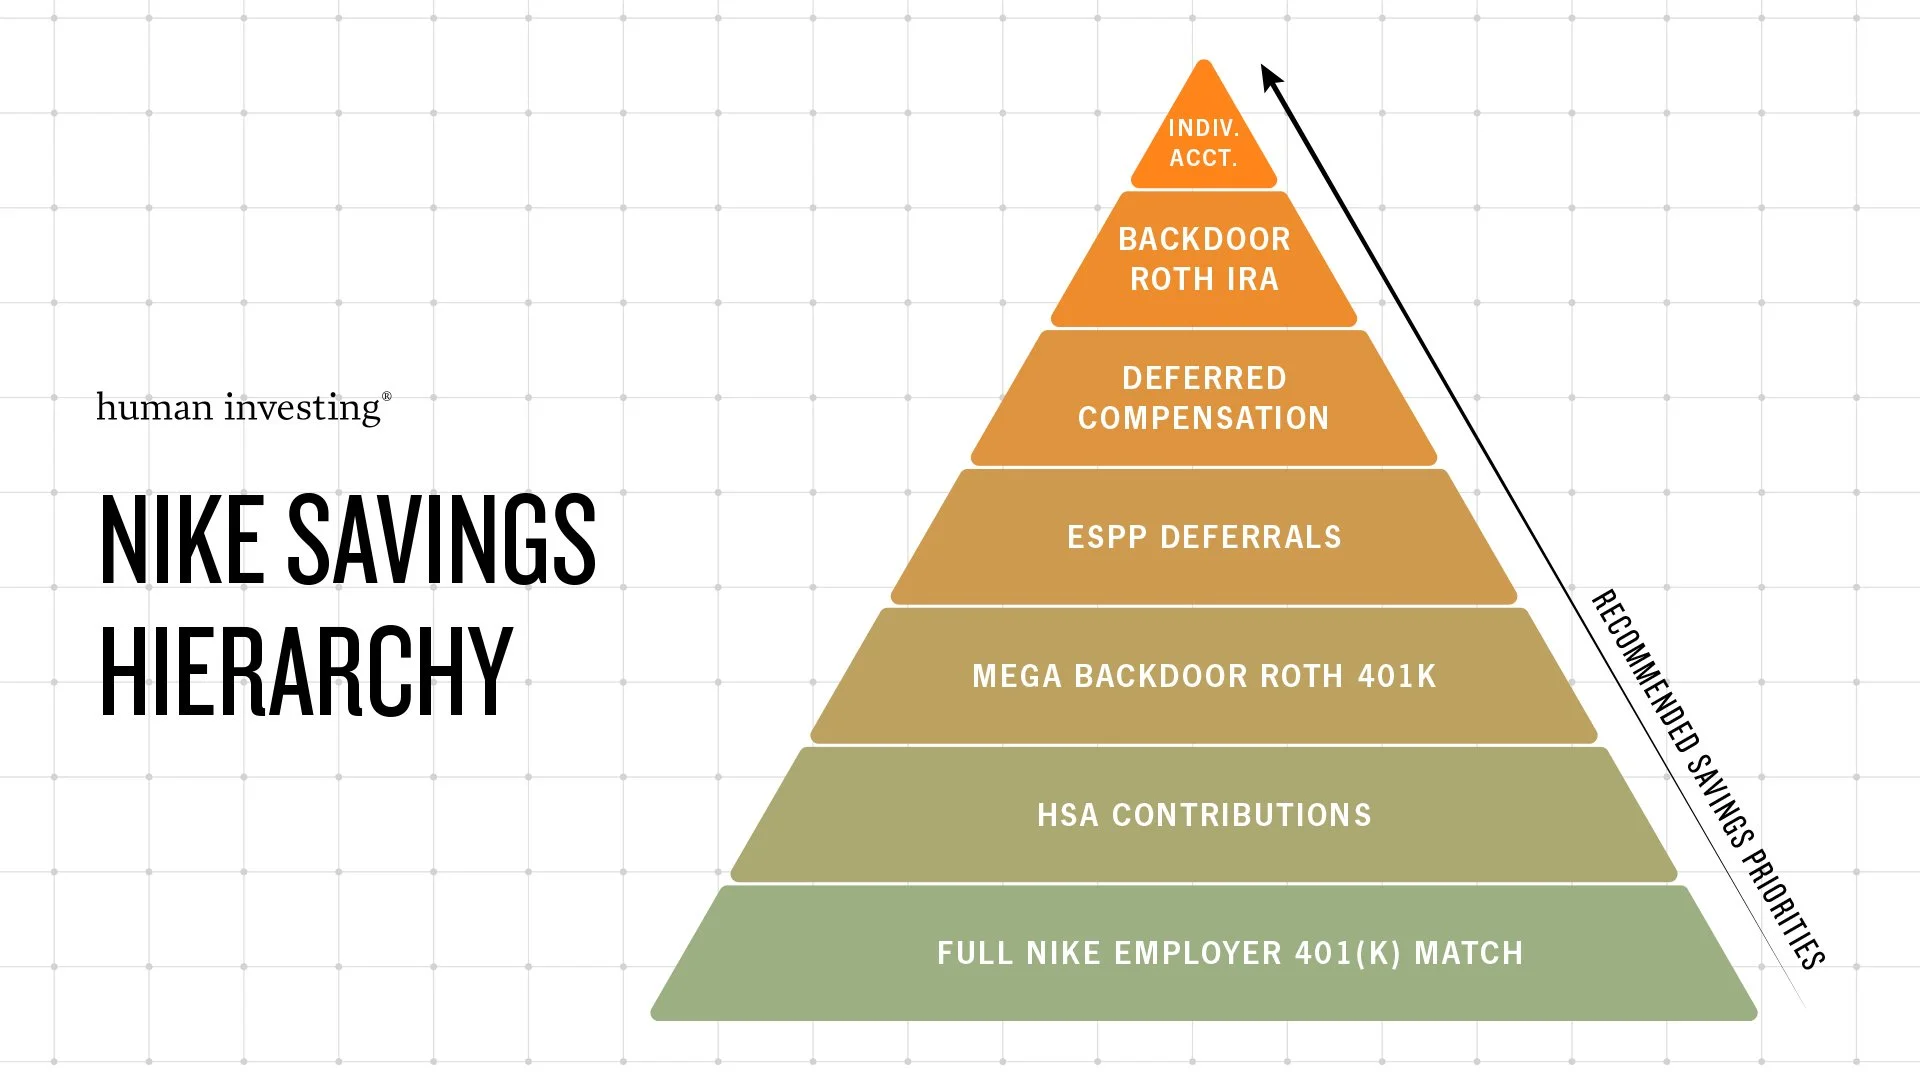
Additional strategies for minimizing your tax liabilities

If you’re looking for more tax savings or want to use your stock benefits to take care of tax payments, we highly recommend proactive tax planning. This involves looking beyond the past year and anticipating opportunities to reduce taxes in the future.

Proactive tax planning common solutions include:

1. Maxing out your Nike 401(k) with pre-tax contributions

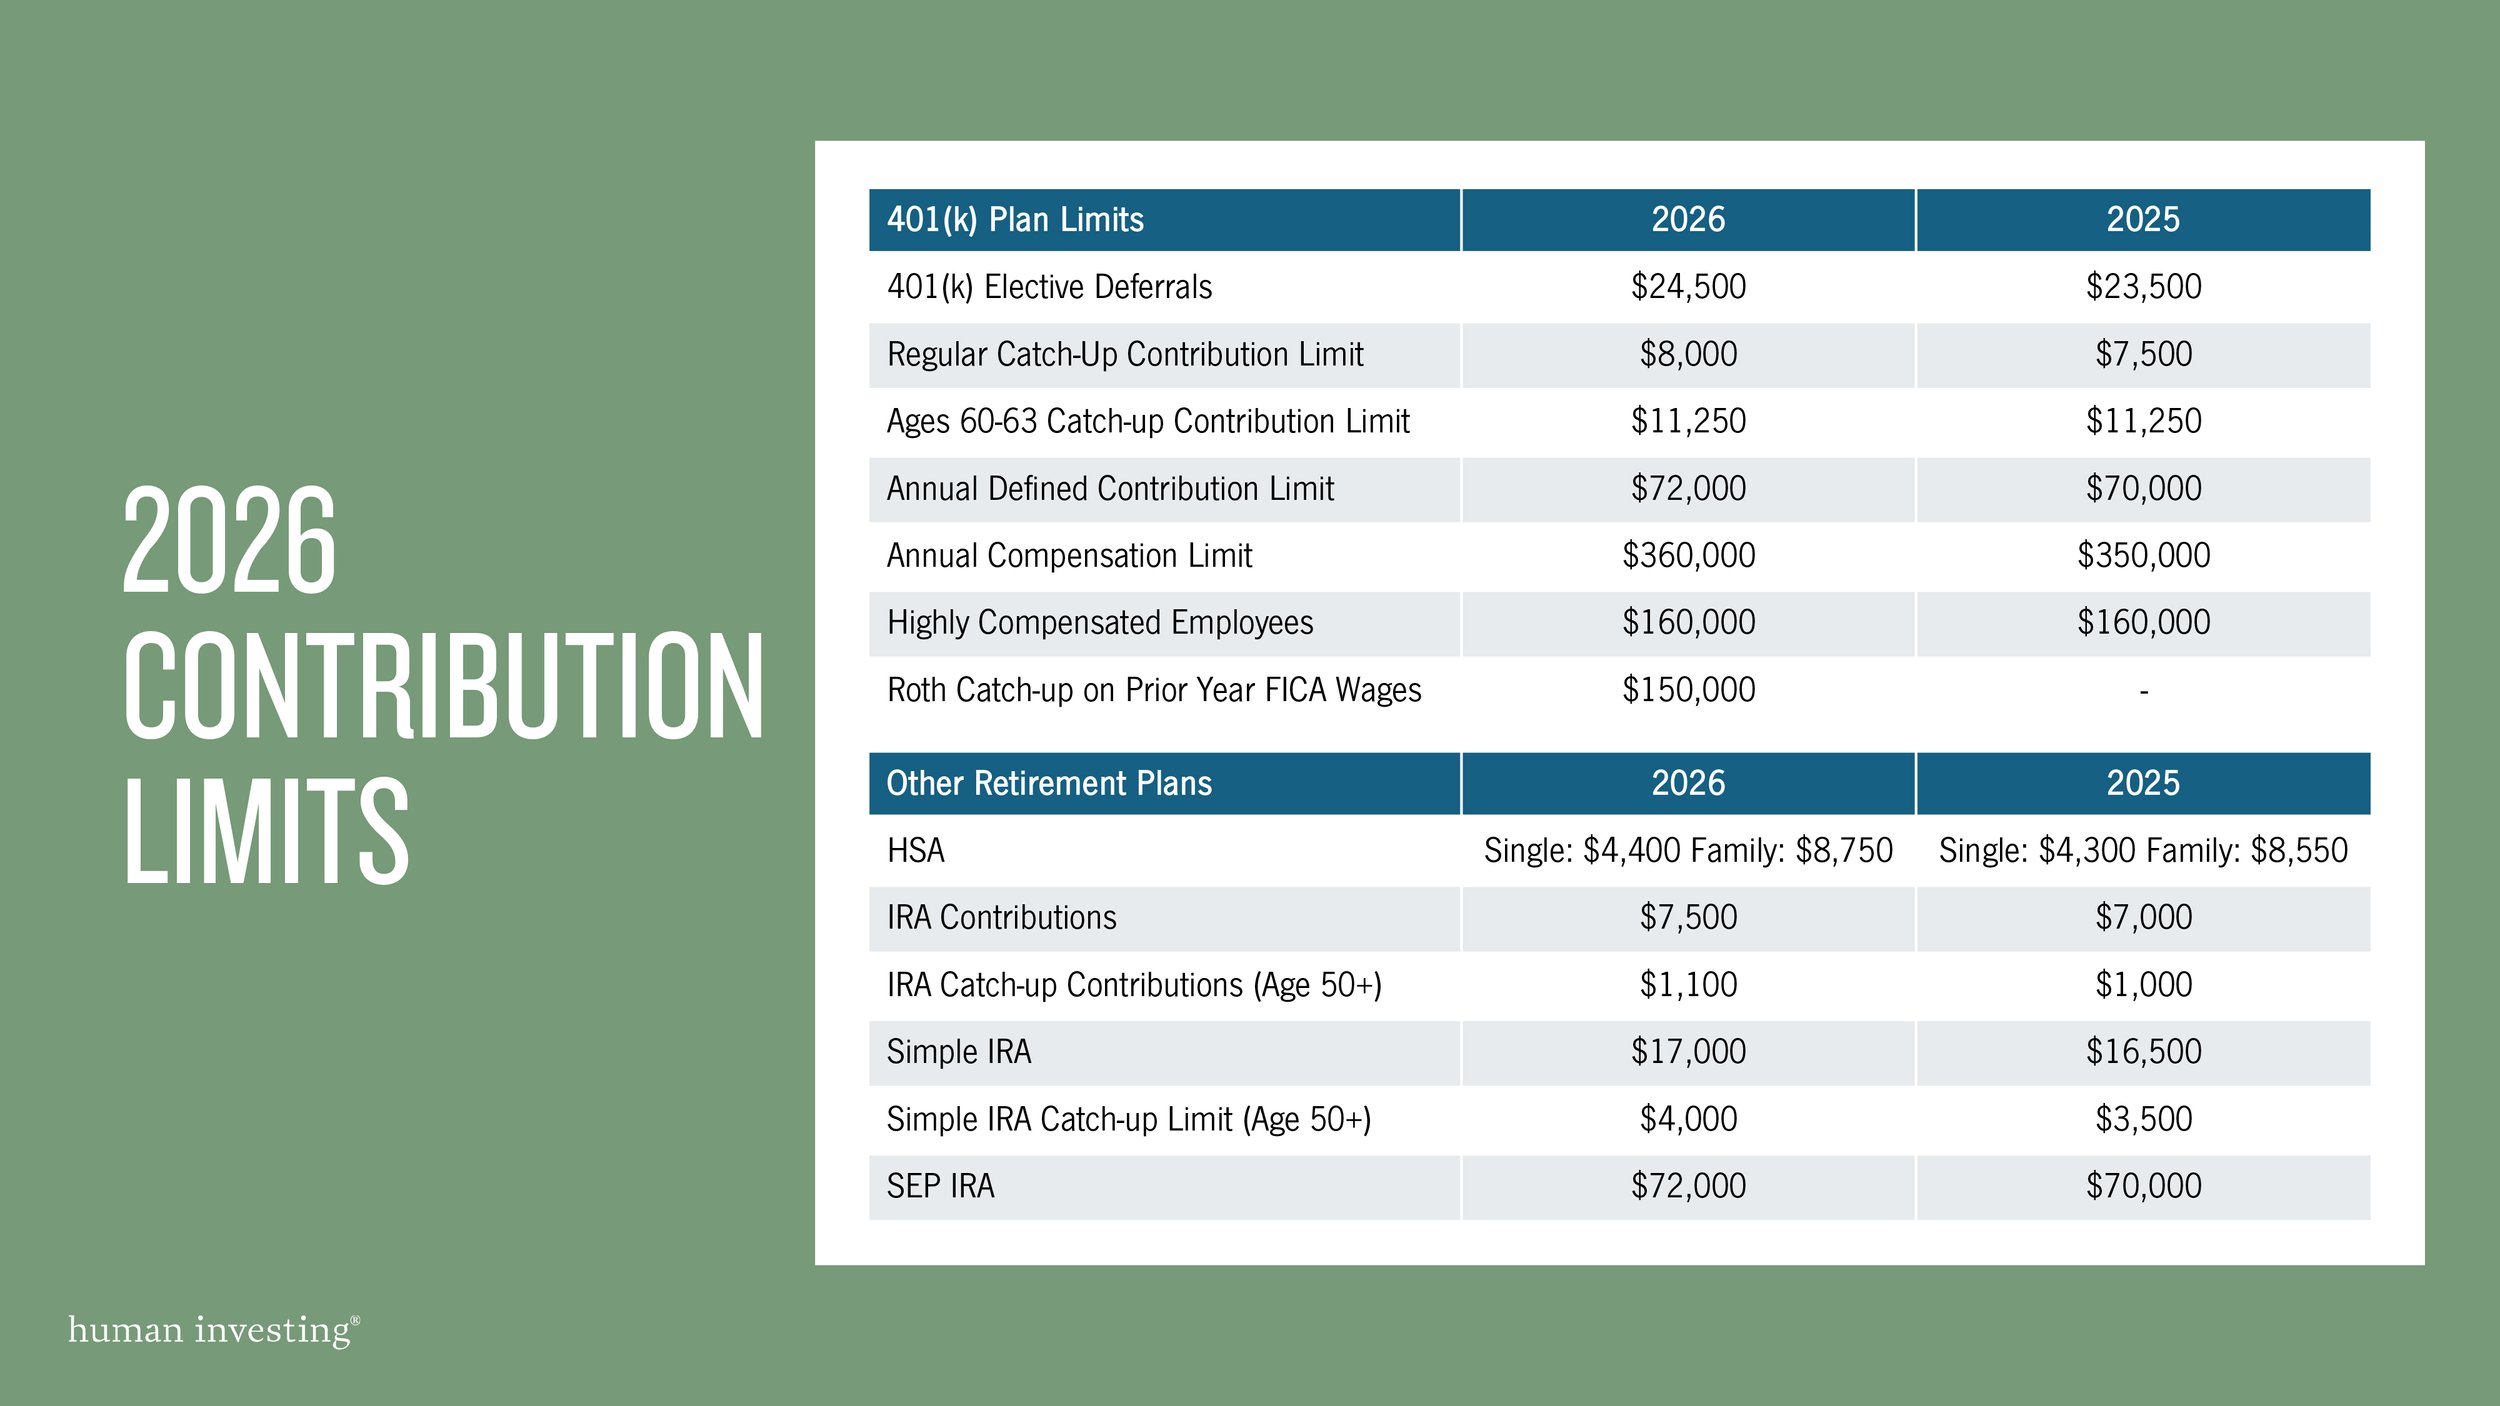
This is a simple strategy, yet it is often missed.  With the maximum contribution amount increasing periodically with inflation and with opportunities for additional catch-up contributions at age 50, forgetting to review your contribution percentage each year is common.  We recommend reviewing your 401k contribution amount after your PSP bonus is paid, since it is a variable amount that is part of the equation.

2. Selling the right type of Nike stock

If you ever need funds from Nike stock, find the most optimal type of Nike stock to sell to minimize your taxes. Typically, RSUs are preferred over ESPP from a tax standpoint, but this can depend on when it was purchased/vested, how long it has been held, and what the stock price is at the time.

3. Utilizing the Nike deferred compensation plan to defer your taxable income to a later date 

Nike’s deferred compensation plan is generally the most powerful tax savings tool available for Nike leaders.  There are specific IRS rules and many important considerations to plan around when using this strategy.  To learn more click here.

4. Charitable giving

Most people assume that all donations to charities are tax-deductible.  They can be tax-deductible but are not always, depending on your individual tax situation. To receive a charitable deduction, you need to exceed a certain threshold each year, and it may make sense to “bunch” donations (make multiple years-worth of contributions in a year) to cross that threshold and capture tax benefits. Coordinating your charitable strategy with the Nike charitable match can be an effective way to lower your taxes and benefit your desired charities at the same time. To find out more click here.

5. Residence planning

If you currently live in Multnomah County, you might consider moving to another county, such as Clackamas or Washington Counties, to avoid the Preschool for All tax. This solution should consider the estimated tax savings compared to the cost of selling your home, the tax implications of selling your home, the purchase price of a new home, and the difference in a new mortgage payment (especially because mortgage rates have increased significantly).

6. Planning around the Oregon state kicker

Oregon law has a provision known as the “kicker” credit. This is a surplus credit that is returned to you on your tax return when tax revenue is larger than predicted.  By accounting for this, you can strategically recognize more income in “kicker” qualifying years so that your potential kicker credit is increased.  The last kicker payment was 17.34% of the Oregon taxes you paid in 2020 and the next one is estimated to be even larger

Bring in experienced experts

By implementing a proactive forward-looking tax strategy and payment plan, Nike leaders have a significant opportunity to improve their financial situation and relieve stress related to taxes. It is important to note that any tax payment and mitigation strategies should be part of a comprehensive financial plan that is tailored to your specific financial situation.

If you have questions about how to set up a proactive forward-looking tax strategy, please contact our team to learn more.


Related Articles

Should I Invest in US Treasuries or CDs From My Bank or Credit Union? What are the differences?


Two ways to approach low-risk investments

When considering safe investment options, two popular choices that often come to mind are FDIC-insured CDs (Certificates of Deposit) and US Treasuries. While both offer relatively low-risk investment opportunities, there are some critical differences between the two that investors should be aware of.

FDIC-insured CDs are certificates issued by banks and credit unions that offer a guaranteed rate of return for a specified period. The Federal Deposit Insurance Corporation (FDIC) insures CDs up to $250,000 per depositor per bank, protecting against bank failure. In contrast, US Treasuries are debt securities issued by the US government to finance its operations. They are generally considered one of the safest investments available because the full faith and credit of the US government back them.

One key difference between the two is their liquidity. CDs have fixed terms ranging from a few months to several years, and if you need to withdraw funds before the maturity date, you may be subject to penalties. On the other hand, US Treasuries can be bought and sold in the secondary market and can be liquidated easily, making them a more flexible option.

Another difference is the level of risk. While both investments are considered safe, FDIC-insured CDs carry some risk due to the possibility of bank failure. While the FDIC provides insurance protection, there is always a small chance that a bank may fail, and investors may not receive their full investment amount. On the other hand, US Treasuries are backed by the US government and are considered virtually risk-free.

When it comes to returns, FDIC-insured CDs offer fixed interest rates that are lower than the returns available through US Treasuries. US Treasuries offer a range of maturities and yields determined by market demand, with longer-term securities offering higher yields.

In terms of taxes, both FDIC-insured CDs and US Treasuries are subject to federal income tax, but US Treasuries are exempt from state and local taxes. Additionally, you may be subject to capital gains tax if you sell US Treasuries for more than their purchase price.

Risks of Return on Investment: CDs

It's important to note that the FDIC receives no funding from taxpayers. Instead, it is funded by insurance premiums paid by banks and thrift institutions participating in the program. These premiums are based on the number of insured deposits each institution holds and the risk they pose to the insurance fund. In case of bank failure, the FDIC uses these funds to reimburse depositors for their insured deposits up to the $250,000 limit. This funding system helps ensure the banking system's stability and integrity while protecting depositors from loss.

While the FDIC insurance pool can become insolvent, it is highly unlikely. The FDIC has many safeguards to prevent insolvency, and its record of accomplishment in managing bank failures has been quite successful.

Firstly, as mentioned earlier, the FDIC collects insurance premiums from participating banks and thrift institutions. These premiums are based on the number of insured deposits each institution holds and the risk they pose to the insurance fund. The FDIC also has the authority to increase premiums to maintain the insurance fund's solvency.

Secondly, the FDIC has the ability to sell the assets and liabilities of a failed bank to another institution, thereby minimizing the cost of the failure of the insurance fund. This process, known as a purchase and assumption transaction, allows the acquiring institution to take over the failed bank’s deposits and assume its liabilities. At the same time, the FDIC pays out the insured deposits.

Finally, if the insurance fund were to become insolvent, the FDIC would have access to a line of credit with the US Treasury to cover any losses. The FDIC can also assess additional premiums on insured institutions to replenish the insurance fund.

It is worth noting that while the FDIC has never become insolvent since its creation in 1933, it has come close to doing so during times of economic stress, such as the savings and loan crisis in the 1980s. However, the FDIC's ability to manage these crises effectively and prevent widespread bank failures has helped to maintain public confidence in the banking system and the FDIC insurance program.

Risk of Return on Investment: Treasuries

If the United States were to become insolvent, it could have profound implications for US Treasuries, as the full faith and credit of the US government backs them. The creditworthiness of the US government is a key factor in determining the value of US Treasuries. Default or insolvency could significantly decrease demand for US Treasuries, resulting in a sharp rise in interest rates.

In addition, if the US were to become insolvent, it could lead to a global financial crisis, as domestic and foreign investors widely hold US Treasuries. A default could lead to a loss of confidence in the US government's ability to manage its finances, which could cause investors to sell off their US Treasury holdings, leading to a domino effect throughout the financial system.

However, it is important to note that the likelihood of the US becoming insolvent is extremely low because the US dollar is the world's reserve currency, and the US government can print its currency. This gives the government greater flexibility to manage its debt than other countries.

Furthermore, the US has a long history of managing its debt and has never defaulted on its sovereign debt. Even during times of economic stress, such as the Great Recession of 2008, the US government has been able to maintain its creditworthiness and continue to issue debt.

Overall, while there are risks associated with US Treasuries in the event of a US government insolvency, the likelihood of this scenario occurring is considered low. US Treasuries are still widely regarded as one of the safest investments in the world.

Implications of Printing Currency: A Double-edged Sword

The implications of the US printing more currency are complex and depend on a range of factors, including the current state of the economy, inflation rates, and global economic conditions.

On the one hand, increasing the money supply can help stimulate economic growth by making more money available for borrowing and spending. This can lead to increased investment and consumption, driving economic activity and creating jobs.

However, printing too much money can also lead to inflation, as the increased money supply can cause prices to rise. Inflation can erode the currency’s purchasing power and decrease consumer confidence and economic stability.

Furthermore, printing more currency can also lead to a depreciation of the currency's value relative to other currencies. This can negatively affect international trade, as a weaker currency can make imports more expensive and exports cheaper, potentially leading to a trade deficit.

Overall, the decision to print more currency should be carefully considered, considering a range of economic factors. While increasing the money supply can help stimulate economic growth, it is essential to strike a balance between promoting growth and maintaining economic stability and confidence in the currency.

What’s Your Timetable?

In conclusion, both FDIC-insured CDs and US Treasuries offer low-risk investment opportunities, but there are some key differences between the two that investors should consider. While CDs offer fixed returns and are insured by the FDIC, they are less liquid and carry some risk due to the possibility of bank failure. US Treasuries, on the other hand, offer higher returns, are virtually risk-free, and are more liquid. Ultimately, the choice between the two will depend on an investor's financial goals, risk tolerance, and investment horizon.

Authors Note: This article was written using prompts in ChatGPT. (2023, May 8). The author has independently verified the accuracy of the responses. The author edited and formatted responses from the prompts for clarity.


Related Articles

Economic Update From Human Investing: Yield Curves


What is the yield curve?

The yield curve refers to the current yields of US treasury bonds based upon time until maturity. It’s frequently depicted as a graph to help summarize the data. Typically, a yield curve is upward sloping. Short-term (ST) rates are lower, and long-term (LT) rates are higher.

Wall Street Journal, Bonds & Rates: Yield Curve, April 25, 2023

Reading the yield curve:

  • A “steeper” or “steepening” of the yield curve means short-term (ST) rates are lower, and long-term (LT) rates are higher, resulting in a steeper line when comparing

  • A “flatter” or “flattening” of the yield curve is when ST rates and LT rates are equivalent, or are getting closer to parity

  • An “inverted” yield curve is when ST rates are higher than LT rates, like the current line in the snapshot above.

What determines the yield curve?

All rates on the yield curve are determined by the market. The Fed only controls the federal funds rate, which is only the rate banks lend to each other overnight. Because the market determines the shape of the yield curve, many look to the yield curve as a summary of overall investor sentiment to draw conclusions about expectations for the future. Some important market factors that influence the yield curve include:

  • Liquidity (time horizon): The more time until a bond matures, the longer you have your money tied up. As a result, a longer time to maturity (and lower liquidity) bond tends to have a higher yield. This contributes to an upward sloping yield curve.

  • Growth expectations: If there are higher growth expectations, you tend to see a steeper yield curve. This is because higher growth tends to lead to higher inflation, and so rates must be higher to achieve positive real returns.

  • Demand: As more investors demand a bond, the price goes up. As bond prices go up, yields go down.

Why is the yield curve inverted, and why does that indicate a recession?

The yield curve is inverted because ST rates are higher than LT rates. This is largely due to The Fed raising interest rates to lower inflation. The Fed appears determined to reign in inflation, and has raised ST interest rates to slow down the economy enough to reduce inflation. This is putting upward pressure on ST rates. Many expect this approach to cause a recession, which would lower growth expectations, reducing LT interest rates. The result is the inverted yield curve we see today.

Why does this inversion indicate a recession?

In theory, the market is pricing treasuries so the returns over a given time period are the same, regardless of what you buy today. Let’s use an example to illustrate this.

Say you want to invest $10,000 in treasuries for 2 years, you can make two choices:

  1. Choice #1: Buy a single 2 year treasury

    • Currently a ~4.2% yield, so you earn roughly 4.2% for 2 years.

  2. Choice #2: Buy a 1 year treasury today, then a new 1 year treasury in 1 year:

    • Currently a ~4.7% yield, so you earn roughly 4.7% for 1 year.

    • After the first year, your treasury will mature, and you will have to purchase a new treasury at whatever the current rates are. The yield curve today is predicting 1 year rates will be at 3.7% in the following year.

    • Your overall return after averaging those rates for each year is 4.2% — the same as buying a 2 year treasury initially!

A lower rate in the future indicates lower growth expectations at that time. Growth expectations being lower (or negative) does not bode well for the health of the economy. The inverted yield curve also has a solid record of predicting recessions, but that doesn’t mean it’s perfect or guaranteed. The yield curve reflects the average sentiment of the markets, which indicates what expectations are. Sometimes expectations create a self-fulfilling prophecy situation, and sometimes expectations are flat out incorrect because of an unexpected shock, like the COVID-19 pandemic.

What does this mean for me and my portfolio?

Ultimately your portfolio should be allocated for the long term, and that should be positioned accordingly. While the inverted yield curve has been a strong predictor of recessions, the timing of that prediction and how significant it’s going to be are not consistent enough to provide an easy 5 step solution for everyone.

If you are positioned towards the more aggressive end of what you are comfortable with, consider reducing risk with some volatility expected on the horizon. Understand that regardless of the yield curve today, the long run expectation is growth and positive returns for the economy and equity markets.


Related Articles

Planning for your child's education in Oregon
 

The cost of education, especially 4-year accredited university programs, continues to rise. The graphic below shows the average annual cost of college nationwide from 1980-2021 far outpacing the maximum Federal Pell Grants offered over the same time period. 

If there is an ability to pre-fund college, in whole or part, it will have lasting financial implications. Funding college early at the birth of a child or grandchild to a college savings account could reduce the future funding liability by six figures. 

In this article, we will discuss some ways you can start saving for your child’s education.

The most popular option, the 529 Savings Plan

A 529 College Savings Plan is one of the most popular options when saving for college. Not only does the money you contribute to a 529 plan grow tax-free but any distributions used for qualifying education expenses (tuition, room & board, books, computer, etc.), are tax-free as well. In the past, qualified expenses were limited to just tuition and boarding but recently the government has expanded this list. Beneficiaries of a 529 plan can also use the money to pay for trade school, community college, or even a 3-month certificate program.  

Oregon has a state-sponsored 529 Plan that allows residents to receive tax benefits for contributions they make to a plan in the state. This gives you a triple-tax benefit. Contributions to fund the account have a tax benefit, growth is tax-free, and qualified expenses are tax-free. There are also private plans that qualify under Oregon-state law. As of 2023, contributors can receive up to $300 in tax credits depending on their filing status and household income. As of 2023, families can contribute up to $17,000 annually in a 529 account. Anything after that is considered a “taxable gift” and subject to gift tax laws.  

Another feature about 529s starting in 2024 and beyond is that any leftover money up to a lifetime amount of $35,000 can be rolled over into the beneficiary’s Roth IRA.. For example, let’s look at two parents who invested $50,000 into a 529. Their child received a full scholarship to the college of their choice. The child ends up only spending $10,000 to cover other expenses during their time in college. That student can then roll over a lifetime amount of $35,000 into their Roth IRA account, as long as they have earned income and the 529 account has been established for 15 years.  

Coverdell ESAs act very similarly to 529 plans due to the withdrawals being tax-free for qualifying expenses. However, contributions are limited to $2,000 per child annually and are only available to families below certain income thresholds. 

Special accounts: Uniform Gifts TO Minors Acts (UGMA) or Uniform Transfers to Minors Acts (UTMA)

UGMA or UTMA accounts can help you save for college but aren’t just reserved for education. These accounts are savings accounts that are controlled by a parent or guardian, known as a “custodian.” You can gift up to $17,000 per year (as of 2023) in assets that are held in a custodial account until the child turns the age of majority (Age 18 or 21 depending on the state). In Oregon, the dependent cannot take over the account until they are 21.  

The custodian of the account can use this money only for the benefit of the minor to pay for things like food, education, and living situations. 

Pre-pay for college tuition and tuition discounts  

Unfortunately, in Oregon, there is no State-sponsored pre-payment plan for college tuition. There may be some private ones, but they are expensive. Some people do this in other states to pay for the full tuition during the current year rather than wait 17-18 years when prices go up even more. For your reference, here are states that offer pre-payment programs.

There is also a program known as the State and Regional College Tuition Discounts. Oregon has several schools that are members of the Western Interstate Commission for Higher Education.  

For more information about this make sure to research the WICHE site and Oregon’s student aid site.

Alternatives to college that can fast track career development

Despite the rising costs of college, there are other options to consider. College is not for everyone and you may decide not to send your student to college right away if you cannot afford to do so.  

Many high-paying and rewarding career paths do not involve a college degree like: 

  • Computer programming and coding 

  • Loan officers 

  • Pilots 

  • Plant operators and managers 

  • Graphic designers 

  • Trades like plumbers, welders, carpenters, farmers, etc. 

  • Sales reps  

  • Business owners and managers 

Community colleges, trade schools, and certificate programs are a fraction of the cost of a 4-year college program and in most cases pay well with little to no debt. Plus, 529 Plans cover these types of education programs too (certain restrictions may apply).  

Some 17-year-olds may not know what they want to do yet. They can work a job, apprentice under an expert, or even start their own business and find their passion before committing to a major program in college.  

If you need more advice, financial planners and advisors can assist you with planning for your student’s future. These laws vary from state to state so talking with a team of experts who are knowledgeable in this area is a wise choice.  

If you are looking to hire an advisor, please connect with us.


Related Articles

Retirees, here’s how the Secure Act 2.0 can positively impact your RMDs and retirement plan
 

A newly passed bill known as Secure Act 2.0 will change how retirees withdraw from their retirement nest eggs. This fundamental change increases the age at which investors must take money from their retirement accounts, bringing about some impactful financial planning opportunities.

What is an RMD?

Once an investor reaches a specific age, they must withdraw a required minimum distribution (RMD) from their retirement account, such as an IRA or 401(k). The RMD amount is determined by the account holder's age and account balance at the end of the previous year. The Internal Revenue Service (IRS) requires RMDs to ensure account holders pay taxes on their retirement savings. RMDs, therefore, can be taxed on both federal and state taxes.

After reaching their RMD age, account holders must begin taking withdrawals from retirement accounts by April 1. Each subsequent year, RMDs must be taken by December 31st of that same year. The IRS may levy a sizable penalty for failure to take the mandatory distribution.

Good news, RMDs will be delayed by a year

A notable update from Secure Act 2.0 is the delay of RMDs. RMDs will start at age 73 instead of 72 for those born in 1951-1959. For those born in 1960 or later, RMDs will be delayed even further to age 75.

For those who turn 72 in 2023, you will not need to start your RMDs this year. Your first RMD can either be taken by December 31, 2024 or delayed until April 1, 2025.

There is no impact on a retiree if they have already started taking their RMDs or need their IRA to cover their cost of living. For others, who only take RMDs because they are required to, this significant modification to the RMD age provides additional retirement planning opportunities.

Retirement Planning opportunities

There will be more time for growth.

The new RMD regulation will give retirees a simple yet powerful benefit, more time for compounding growth. As the billionaire investor Charlie Munger states, “The first rule of compounding is to never interrupt it unnecessarily.”

This benefit must be highlighted, especially after a year of market losses.

An 8% return on a million-dollar IRA is $80,000. Additional returns undisturbed by an unnecessary RMD can have a snowball effect, providing an exponential lifetime benefit.

A longer window before RMDs can allow for additional planning and time, the essential ingredients in building wealth.  

QCDs can still be maximized.

Amidst the RMD age adjustment, the age at which account holders can use their IRAs to make Qualified Charitable Contributions (QCDs) was untouched. Thus, preserving one of the most powerful tax-saving strategies available to charitably inclined retirees 70.5 and older.

A QCD is a tax-free transfer of funds from an individual's IRA directly to an IRS-recognized charity. This charitable distribution allows taxpayers to avoid paying taxes on the withdrawn funds.

Retiree “Gap Years” are extended.

"Gap Years" are the years that occur between a person's retirement and the beginning of their RMDs. These Gap Years are often the years with the lowest taxable incomes in a person's adult life. As a result, they frequently serve as ideal years for accelerating income that would otherwise be taxable in a subsequent, higher-income year. The Secure Act 2.0's changes will give additional time for Tax Bracket optimization strategies such as Roth Conversions and Capital Gain Realization to reduce an investor's lifetime tax bill.

You may be pushed into a higher tax bracket in your later years.

Like all financial planning strategies, there is no one-size fits. The unanticipated pitfall of postponing RMDs can lead to more significant withdrawals in subsequent years when RMDs do start. An unexpected boost in income from RMDs might push you into a much higher tax bracket, phase you out of a tax credit, or trigger a surtax. Taking the time to understand the applicable tax implications are crucial when building a tax-sensitive retirement income plan.

This is a great time to reevaluate your retirement plan

The retirement system has undergone numerous changes due to Secure Act 2.0's policy reforms, adding to the difficulty of retirement planning. Recognizing the planning opportunities and risks that relate to you and your financial plan is essential.


Related Articles

Quarterly Economic Update from Human Investing
 

It’s a new year, and there are still plenty of old questions about the economy & markets. We thought diving into some questions about today’s economy would be helpful.

2023 Economic Outlook

Many different sources (See Table 1) forecast a recession for 2023. With The Fed combating inflation by raising interest rates, expectations are these moves will force the economy into a downturn. The extent of the recession may depend on The Fed’s actions. If inflation recedes quickly, and The Fed cuts rates or stops raising them, that could minimize a recession or possibly avoid a recession entirely—this is called a “soft landing.” If inflation persists, and The Fed is determined to lower inflation in the face of a declining economy, the recession could be worse. However, market forecasts expect The Fed to cut rates in 2023 in response to a recession. The Fed has yet to forecast those same rate cuts. Based on our observations, the odds are we will experience a mild recession in 2023.

2023 Investment Outlook

Despite the prospects of a recession, investments grow over the long run, and volatility is expected. As we’ve previously covered, it can take years for your portfolio to recover from a downturn. We have always seen markets recover to new all-time highs. With a looming recession, 10-year forecasts for US stocks remain positive.


Downturns present a buying opportunity for investors, particularly workers accumulating for retirement. Continuing to purchase when stocks decline is an excellent investment. Saving more when times are tough is challenging. Ensure you are in good financial shape: have 3-6 months of expenses saved in an emergency fund, pay off any high-interest debt, and consistently spend less than you make. Then consider increasing your savings. Increasing your contribution rate is a wonderful forced savings tool if you have a 401(k) or similar plan.
 
Markets and the Economy
You may have heard the market is forward-looking. We know the market is a flawed prognosticator because prices still adjust daily to reflect new information. Let’s examine how closely market bottoms coincide with recessions.
 
There have been 11 recessions since 1950, according to the National Bureau of Economic Research (NBER). Using the NBER’s trough dates (i.e., the end of a recession), we can compare GDP with the S&P to see when both hit their lowest point. Looking at Table 3, the S&P 500 tends to do one of two things:

  1. The market is at its worst about the same time as the economy.

  2. The market is at its worst approximately six months before the economy bottoms out.


There are some caveats. Market data is live, and markets are open every business day. GDP data comes out quarterly, advance estimates come out nearly a month after the fact, and aren’t fully revised until around 60 days after initial release. For both the market and economy, knowing when you’ve hit bottom is nearly impossible to determine in the moment. Because it’s difficult to know when the worst is over, we recommend staying invested amidst the potential short-term tumult.

Be prepared for some turbulence this year

Economists and market prognosticators are expecting there will be a recession in 2023. The severity of the recession will vary depending on The Fed. The Unemployment rate remains below historical averages at 3.5%. In November 2022, there were nearly 6 million more job openings than job seekers, suggesting the economy can handle some tightening. Trying to time the market or economy bottom remains a guessing game. Long term, the outlook for returns is still strong. Be prepared for some turbulence this year, knowing you are headed in the right direction long term.

Sources
1. Federal Reserve Bank of New York. The yield curve as a leading indicator. January 2023.
2. The Wall Street Journal. Economists in WSJ survey still see recession this year despite easing inflation. January 2023.
3. Bloomberg. Economists place 70% chance for US recession in 2023. December 2022.
4. Vanguard. Vanguard economic and market outlook for 2023: Beating back inflation. December 2022.
5. BlackRock. 2023 global outlook. January 2023.
6. Charles Schwab. 2023 market outlook: Cross currents. January 2023.
7. Fidelity. Global outlook 2023: New world disorder. January 2023.
8. Charles Schwab. Schwab's 2023 long-term capital market expectations. January 2023.
9. Vanguard. Market perspectives: December 2022. November 2022.
10. BlackRock. Asset return expectations and uncertainty: as of September 2022 November 2022..
11. Data courtesy of YCharts & NBER


Related Articles

Charts of the Year 2022
 

These are some of our favorite charts and graphs that told the biggest stories from 2022.

Stock Market Performance

Each year, the stock market has its narrative around why it performed the way it did. With 2022 coming to a close and, as of 12/21, the stock market down 17.31%, one of the narratives for this year has been persistent volatility. As the chart above shows, 2022 marks the most days (30) that the market was either up or down 1%at the end of the week. 16 of the instances were down days, and 14 of the instances were positive.

In terms of additional narratives for this year, our team has been referencing a year like 2022 as a “price of admission” year. In other words, to receive the benefit of long-term equity returns, negative years (like 2022) are part of the price of admission to achieve the benefits. We reference this chart when looking at the negative headlines the market has overcome over the years.

INFLATION AND SAVINGS

With interest rates increasing rapidly, there have been many moving parts in all areas of the economy. From real estate to food prices, most industries have been impacted. One area that consumers/investors should look to take advantage of is their saving and checking accounts. During the most recent period of low-interest rates, we have become accustomed to these accounts paying little to nothing in interest. However, as the chart above mentions, Americans are leaving dollars on the table by not searching out higher interest bank accounts. Our team recommends utilizing a local credit union which often has new member checking benefits, or aggregator sites like NerdWallet do a good job of providing high-paying savings accounts.

Market Volatility

With all the market downturns and volatility, we thought it would be interesting to see how long it takes to make your money back, depending on how you are invested. Ensuring your allocations are positioned so you can ride out any downturns is essential for any investor. 

Job Market

It's been a unique time in the jobs market. Job openings have exceeded people searching for jobs by nearly 5 million for 2022. The persistence of this even with all the uncertainty around the economy and inflation is surprising. As a result of the pandemic, more people are seeking remote work. LinkedIn revealed that remote jobs, which take up 15.9% of job listings, attract 52.9% of job applicants.

FTX

2022 charts of the year wouldn’t be complete without referencing the rise and fall of the cryptocurrency exchange FTX. Even as I write this, new information surrounding this saga continues to emerge, and it will be a high-profile news story to follow into 2023.

The above chart shows how the organization’s value got as high as $32B as recently as January 2022 during FTX’s most recent round of funding. There are many lessons to be learned from fraud scenarios, and like you, we will follow this story into the new year.


Related Articles

ChartsHuman Investing
2023 Tax Updates: Brackets and Rates Adjusted to Hedge Against Inflation
 

The IRS adjusts tax brackets and rates each year to account for inflation and combat “bracket creep.” Bracket creep is when taxpayers are pushed into higher income tax brackets or do not receive adequate credits and deductions due to inflation. Are you aware of how an increase in the standard deduction and tax brackets will impact you?

What has changed?

1. The standard deduction will increase for the 2023 tax year. See below for a summary of the increases:

 2. Federal income tax brackets will increase to account for inflation in 2023:

What does this mean for you?

While this is welcomed news, these updates will not significantly impact your taxes, cash flow, or budget. These updates are enacted to hedge against inflation and keep things consistent for taxpayers.

In sum, the increase in standard deduction means households will have less income subject to taxes, and the income subject to taxes will be subject to better tax brackets.

We wanted to re-vamp our tax example from 2022 with the updated 2023 numbers to provide a familiar and helpful guide to your taxes. Read on to see a fictitious example of the impact of the increased standard deduction and tax brackets in 2023.

Meet Martin & Angela

Below is a breakdown of their taxable income and taxes due in 2022 compared to 2023.

As you can see, they reported $100,000 of combined income, which is reduced by their pre-tax 401(k) contributions and the standard deduction of $27,700. Because the standard deduction increased from $25,900 in 2022 to $27,700 in 2023, Martin and Angela’s taxable income decreased. This means they are on track to pay less this year in federal taxes.

PORTIONS OF YOUR INCOME GET TAXED AT DIFFERENT RATES

Tax brackets calculate the tax rate you will pay on each portion of your income. Tax brackets are part of our progressive tax system, which means the tax rate increases as someone’s income grows. There are seven federal tax brackets in 2023 (see image 2).

As shown in the image above, Martin and Angela’s taxable income will be split to take advantage of the lowest tax bracket. This means they will be taxed at 10% on the first $22,000 of their joint income, and their remaining taxable income will be taxed at 12%. In 2022, the maximum income allowed at the lowest tax bracket of 10% was $20,550. In 2023, the maximum income allowed will be $22,000.

If Martin and Angela fall into a higher tax bracket in the future, their taxable income will be broken down into each respective bracket to take advantage of the lower rates on what they can.

DRUMROLL, PLEASE…

After completing this exercise for all their taxable income, you can see that Martin and Angela’s total taxes owed in 2022 is $7,881 compared to $7,636 in 2023. This means they will pay $245 less federal taxes in 2023 than in 2022. While this is welcomed news, it is not a life-changing update.

If you have questions about your unique tax situation, please schedule a time to connect with our team. As always, we would love to hear from you!

Disclaimer: This post is for educational purposes and not predictive of your 2022 tax situation. The fictitious example is not a complete presentation of a tax filing.


Related Articles

Retirement Income Planning: Tax Bracket Optimization
 

We help our clients organize and implement tax bracket optimization. In your early years of retirement, even if you do not have earned income, there are important tax considerations. I will illustrate two recurring tax planning strategies: Roth Conversions and Capital Gain Realization.

Consider a retired married couple (both age 65) living in Oregon this year.

In this example, this couple has $36,700 of taxable income. This places them in the 12% federal tax bracket and provides $52,750 more room inside the 12% bracket before moving into the 22% bracket.

Considering the wiggle room before the increased tax rate, this client could decide between the following options:

OPTION 1: Realize Capital Gains

Realize (sell and reinvest) up to $52,750 of long-term (held longer than 12 months) capital gains to take advantage of the 0% Federal Capital Gains rate within the 12% bracket. This couple living in Oregon would still pay 9% State. Ideally, they pay less taxes today to avoid realizing those gains at 15% Federal and 9% State later, likely during the required distribution timeframe starting at age 73. They would keep 15% more of the growth on their investments.

Option 2: Conduct Roth Conversions

If a client does not have any taxable accounts or unrealized capital gains, they could use the room in the 12% bracket to conduct Roth conversions. This would consist of transferring funds from a traditional IRA, paying the taxes now (12% Federal and 9% State), and putting the net amount into the Roth IRA to grow tax-free overtime. This strategy is helpful to maximize the 12% bracket, since the 12% bracket will revert to the 15% bracket in 2026, when the Tax Cuts and Jobs Act (TCJA) ends. Additionally, when a client turns 73 and is required to take distributions from IRAs, this required distribution amount cannot be converted to a Roth IRA but must be distributed.

Required distributions could also push income from IRAs into the 22% bracket. Another benefit of Roth conversion is that Roth IRAs are not subject to required distribution rules and therefore can continue to grow tax-free for the life of the married couple.

Option 3: Combination of realizing Capital Gains and Roth Conversions

This requires year-by-year income and deductions tracking from all sources to ensure the right amount of money is being realized or converted.

Tax bracket optimization is not an after-thought, but a pivotal component of holistic financial planning offered at Human Investing. If this kind of planning would be helpful to you, please schedule a time to review your situation.


Economic Update from Human Investing
 

As a Charted Financial Analyst serving as the firm’s Director of Investments and Compliance, I oversee the construction and management of client portfolios. How we go about investing client capital involves evaluating a variety of factors that move the markets. Given the economic backdrop for 2022, I thought it would be helpful to address a few of the components impacting the economy and subsequent stock and bond market volatility.

Historical trends suggest the current high levels of inflation will not persist.

 Inflation is higher than it has been for decades, exceeding 7.5% in the March to October 2022 numbers, represented in the purple line below. The breakeven rate between a 5-year Treasury Inflation Protected Security (TIPS) and a standard Treasury is commonly used as a benchmark for what average inflation over the next five years is expected to be. The graph below shows this in orange below, hovering around 2.34%.

What is causing inflation?

There are broadly two types of inflation:

1. Demand-pull inflation occurs when there is too much demand for a limited supply of items (too much money chasing too few goods).


2. Cost-push inflation occurs when the costs of inputs for producers increase, and those costs are passed along to consumers (too few inputs to produce too many goods).

Both factors are helping push inflation higher. Government stimulus in response to COVID and global supply chains having to adjust in response to the pandemic have both had their part in increasing inflation, along with many other factors.

What brings inflation down?

Macroeconomic theory believes that inflation falls when an economy slows down. A slower economy usually means higher unemployment and less spending and investment. This means there isn’t too much demand-pull inflation occurring because higher unemployment means there are fewer wages chasing the goods produced. Higher unemployment also tends to lead to lower cost-push inflation because the cost of labor typically goes down when unemployment is high.

The Fed is still working on a soft landing.

Higher inflation is not healthy for an economy long term. Banks still want to make money even when inflation is high, so they lend at higher rates to ensure they still make a profit after accounting for inflation. Higher interest rates result in a higher cost of borrowing, making any investment (buying a house, going to college, launching a new business, building a new production facility, etc.) more expensive. Households and companies invest less, which means fewer productive and good investments happen, slowing down the overall economy.

Because high inflation is unhealthy for an economy, the Federal Reserve (aka “The Fed”, the US central bank) is raising interest rates. The Fed’s goal is to raise interest rates high enough to slow down the economy and bring down inflation. The concern is that The Fed will be too aggressive in raising interest rates and cause a sharp economic downturn. The hope is The Fed can execute a soft landing, slowing down the economy enough to reign in inflation but not slowing down so much to trigger a major recession.

The job market is still experiencing labor scarcity.

Currently, there are about 5 million more open jobs than people looking for a job. Unemployment is below 4%, near the historical lows we were experiencing pre-pandemic. Due to labor scarcity, employees are seeing their wages rise.


The overall economy is seeing consistent growth.

Gross Domestic Product (GDP) is the most used measure of the size of an economy. Real GDP (rGDP) accounts for inflation. The orange line is a “trendline” for real GDP, based on the average growth of rGDP from 2012 to 2017. As you can see, GDP is not far off from what would have been expected if the COVID downturn & recovery had never occurred. While the first half of 2022 had two-quarters of negative GDP growth (a common definition of a recession), Q3 2022 saw the economy grow.


Company earnings are still increasing despite downturns.

The following chart illustrates earnings growth compared to the S&P 500. The market tends is forward-looking, setting prices based on what is expected to happen. Current fears about inflation & The Fed triggering a downturn by raising interest rates too much too quickly are pushing the market down. Earnings reflect what companies earned in the previous three months. While there is a lot of anxiety about the state of the economy, companies are continuing to earn money and will continue to do so even in a downturn.


What does this mean for you and your portfolio?

In conclusion, there are contradictory messages. The economy quickly recovered from the global pandemic, and the workers are enjoying a solid labor market with wages rising. The positive economic news is contrasted with poor investor experience in the stock market. Concerns about high inflation and The Fed’s anticipated aggressive rate hikes to combat inflation have the market worrying about a recession. With all this happening, companies have continued to grow their earnings.

While there is conflicting information in the short term, we continue to anticipate long-term growth in the economy and stock market. Having a sound financial plan that accounts for downturns and uncertainties is crucial. Feel free to reach out if you have any questions about your plan or have had any changes in your financial situation.

All data courtesy of YCharts Nov 29, 2022.


Related Articles

Maximizing Your Monthly Cash Flow
 

People often talk about what they’d do if they had “extra” money. The reality is, though, that there’s not really such a thing as “extra” money. Extra means left over, or a surplus. For almost everyone, there’s somewhere that money should be going, whether it’s to pay down debt, add to a savings account, invest, or begin planning for retirement. Thus, it’s not actually extra, even if all your bills are covered.

Your job with whatever money comes your way is to make it work for you. You have to tell your money where to go or it will tell you where you can and can’t go—on vacation, for example.

The best way to ensure that all your money is going where it needs to is to make a monthly budget—and stick to it. You must think of your monthly budget as a dynamic document; it’s going to change and adjust to whatever life brings your way.

Review Your Inflows and Outflows

Money comes in, and money goes out. Often, it feels like it’s going out before you even have it in hand. Get better control over this feeling by creating a document that helps you see exactly what’s coming in and where it needs to go.

Create your budget.

Use a spreadsheet on a program such as Excel, Numbers, or Google Docs to help you draft an understanding of your monthly income and expenses. Don’t forget to account for any expenses you have that occur annually or semi-annually, such as car insurance.

Choose a document that you have easy access to and that feels comfortable for you to use. You can also make a note on your phone with all the bills that come out each month or pay period, and you can check them off as they come out of your bank account. That way, you always know what’s going to come out during the next couple of weeks so you don’t overspend.

Take an honest look at your spending.

Analyzing where we might be part of the problem isn’t always easy. However, the truth is that many people make enough money to live on, and they simply live outside their means, accruing debt at an exponential rate. Look carefully at where all your money is going, down to the last dollar.

How much do you spend on eating out for lunch? Are you buying new clothes every month? Do you have a handful of monthly subscriptions that you aren’t using or that you don’t need? You have to balance your spending with your financial goals. If you want to save more money, then maybe you can think about packing lunches from home or only buying clothes on sale. Or, you can cancel those unused accounts and automatically put that money toward your savings account.

Check out some of the programs available to help you budget, such as Mint, You Need a Budget (YNAB), or EveryDollar. Some programs are free or have a no-pay level, but others offer advanced budgeting and investing advice for a monthly or yearly fee. However, before you sign up for a service that costs money, determine if what it offers aligns with where you need help. You also need to determine if you’re committed to tracking your spending and sticking with a budget; otherwise, it will just be more money going out that you aren’t using. Start with free resources like Google Docs or Notes, and then move on to a paid service such as YNAB.

Grow your emergency account.

No one wants to live paycheck to paycheck. It’s stressful and frustrating, and you’re living to work instead of working to live. Growing your nest egg has to start somewhere, and once you see how good it feels to have a hefty chunk of savings that you can rely on (instead of a credit card) it will motivate you to keep going with responsible financial planning.

We advise all our clients to have three to six months of monthly expenses in an emergency savings account. This savings account will not only enable you to use cash for an emergency instead of an interest-racking credit card, but it will serve as a constant reminder of how hard you’ve worked to get to where you are. This emergency account should be able to cover rent, food, transportation, and a phone for at least six months. Once you have it built up, you can feel free from the vicious cycle of credit cards. Whenever you have to pull from your account, like if your car breaks down, pat yourself on the back for having cash on hand. Then, build it back up again before you begin saving for or investing in something else.

Consider becoming a credit union member.

If you’re overwhelmed by the idea of building and sticking to a budget on your own, community credit unions have trained financial coaches who help members build and stick to a budget. These financial coaches can help answer questions and give you feedback about your budget. We work closely with Rivermark Community Credit Union, and they have financial coaches at every branch who can work with members to create a budget, plan for their finances, or consolidate debt. Best of all, this service is included as a benefit of credit union membership!

Don’t be ashamed about needing to ask for guidance! People all over the world have struggled with debt since trading and currency made their way into human culture. We have to learn financial literacy and take responsibility for our spending—these things aren’t usually taught in school or during adolescence, so most adults have to figure it out themselves. Use your resources and choose to prioritize your future.


Related Articles