Posts in Financial Planning
2023 Q4 Economic Update: Labor’s impact on the economy


In recent months, I’ve been pondering the US labor force and how it has changed in the last five years. Amid the ongoing conversations surrounding inflation and the Federal Reserve's (aka The Fed) recent decisions to raise interest rates to manage inflation, I don’t want to neglect the other part of The Fed’s dual mandate: the dynamics of unemployment and the labor force. Prior to COVID-19, unemployment was at 3.5%, the lowest rate in the last 50 years. Today unemployment is around 3.8%, and has been 4% or lower since December 2021, significantly below the median unemployment of approximately 5% the US has experienced over the last 25 years. Since March 2021, job openings have consistently surpassed the number of job seekers.

Unemployment is often considered an indicator of an economy’s health. Like inflation, you want some unemployment, but not too much. Too high unemployment indicates a weak economy. If unemployment is too low, high inflation becomes a concern. Businesses seeking to grow may be constrained because of a lack of workers, limiting overall economic growth.

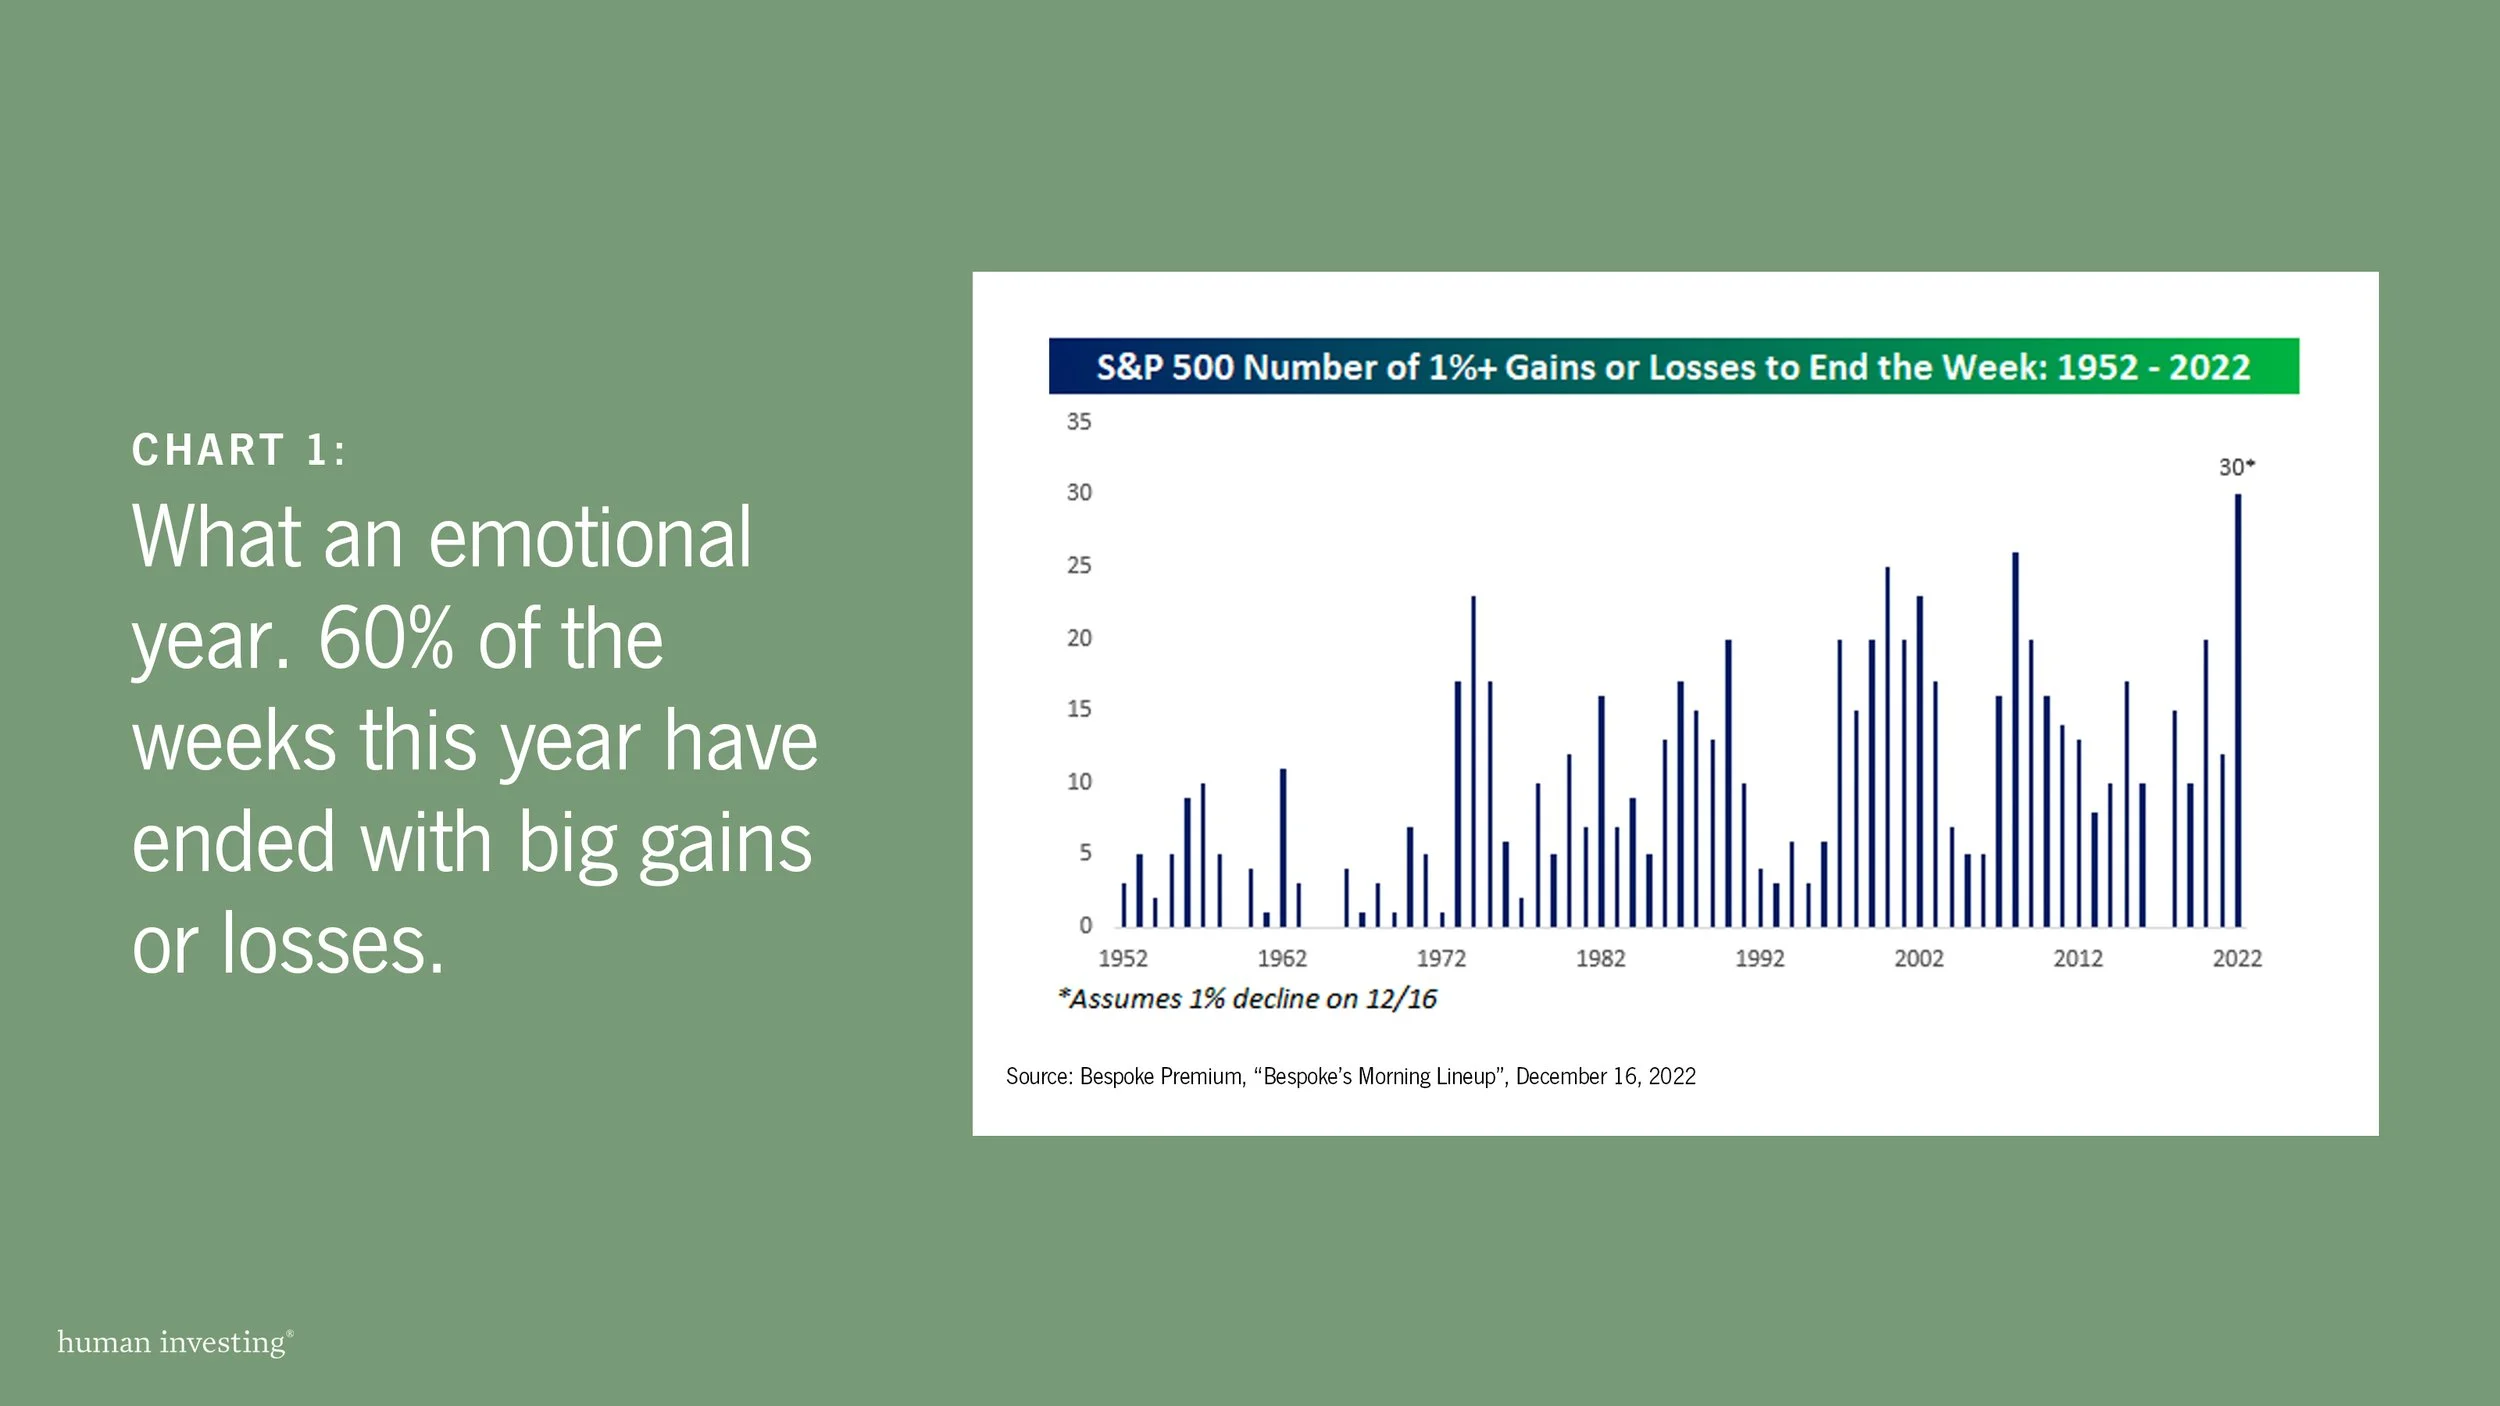
Strong employment is a major reason why 2023 has not experienced the recession that many feared at the beginning of the year. I wanted to delve into the reasons behind the tight labor market, what can be done about it, and what this signifies for the overall economy.

Labor’s impact on the current economy

The fundamental assumption in most economic models is that production is constrained by two primary inputs: labor (i.e. workers) and capital (i.e. technology). While technology has yielded significant advances in productivity, the necessity for a workforce to drive economic growth remains. A shortage of labor would imply slower economic growth, potentially resulting in reduced stock market growth.

Concerns persist regarding automation displacing jobs. Some have even proposed the implementation of a universal basic income due to the scarcity of employment opportunities resulting from automation (as exemplified by former presidential candidate Andrew Yang, who made this a central theme of his campaign). A variation of this concern has been present for over a century.

The latest development in automation centers around AI potentially increasing productivity to the extent that we might encounter a surplus of labor. Numerous case studies illustrate that technological change does not always materialize as successfully or rapidly as initially projected. A decade ago, there was much buzz about how autonomous cars were poised to revolutionize the world. Substantial progress has been made, but the challenge of perfecting driverless cars has proven more intricate than many had anticipated. (An example is Moral Machine, where you weigh in on how a self-driving car should navigate situations where the car must choose who to protect in an unavoidable collision).

Another illustration can be found in the excessive optimism at the peak of the dot-com bubble. While the internet did transform the way we work and introduced new efficiencies, it took significantly longer than what people in 1999 had envisioned. Forecasting the timeline for technological change impacting worker productivity is challenging.

If I had to guess, I would anticipate that in the near term (i.e. the next 5 years), we will continue to experience a tight labor market that will be a headwind to growth, for the economy and the stock market.

Retiring baby boomers present a significant challenge

By 2030, the youngest Baby Boomers will turn 65. The average American retires at 64. These retiring Baby Boomers possess the most expertise and would ideally be succeeded by Gen X workers with slightly less experience. However, Gen X is too small of a generation to fully replace the baby boomers, and Millennials & Gen Z broadly lack the experience necessary to fully replace the skills of retiring baby boomers.

This is backed by recent projections by the Bureau of Labor Statistics (BLS), showing that total employment is expected to grow by only 0.3% annually for the next decade, with a significant constraint being the slower growth of the working age population. Slowing growth in labor likely means slowing growth in GDP and stock prices.

Furthermore, there has been a consistent decline in the labor force participation rate over time. This is a measure of everyone 16 and older who is not in the military or an institution (due to criminal activity, mental health, or aging). Part of this reflects the aging population. As the proportion of the population beyond retirement age increases, a smaller segment of the population remains in the workforce.


How can we increase labor?

Gen Z is entering the workforce, but as a generation, they are too small to completely replace retiring baby boomers. Producing more working-age adults takes at least 16 years and 9 months, and the US birthrate has been below the stable replacement level of 2.1 for most of the last 50 years. If the US wants to sustain long-term population growth, and consequently, workforce expansion, it must either depend on immigration or find ways to boost the birth rate.

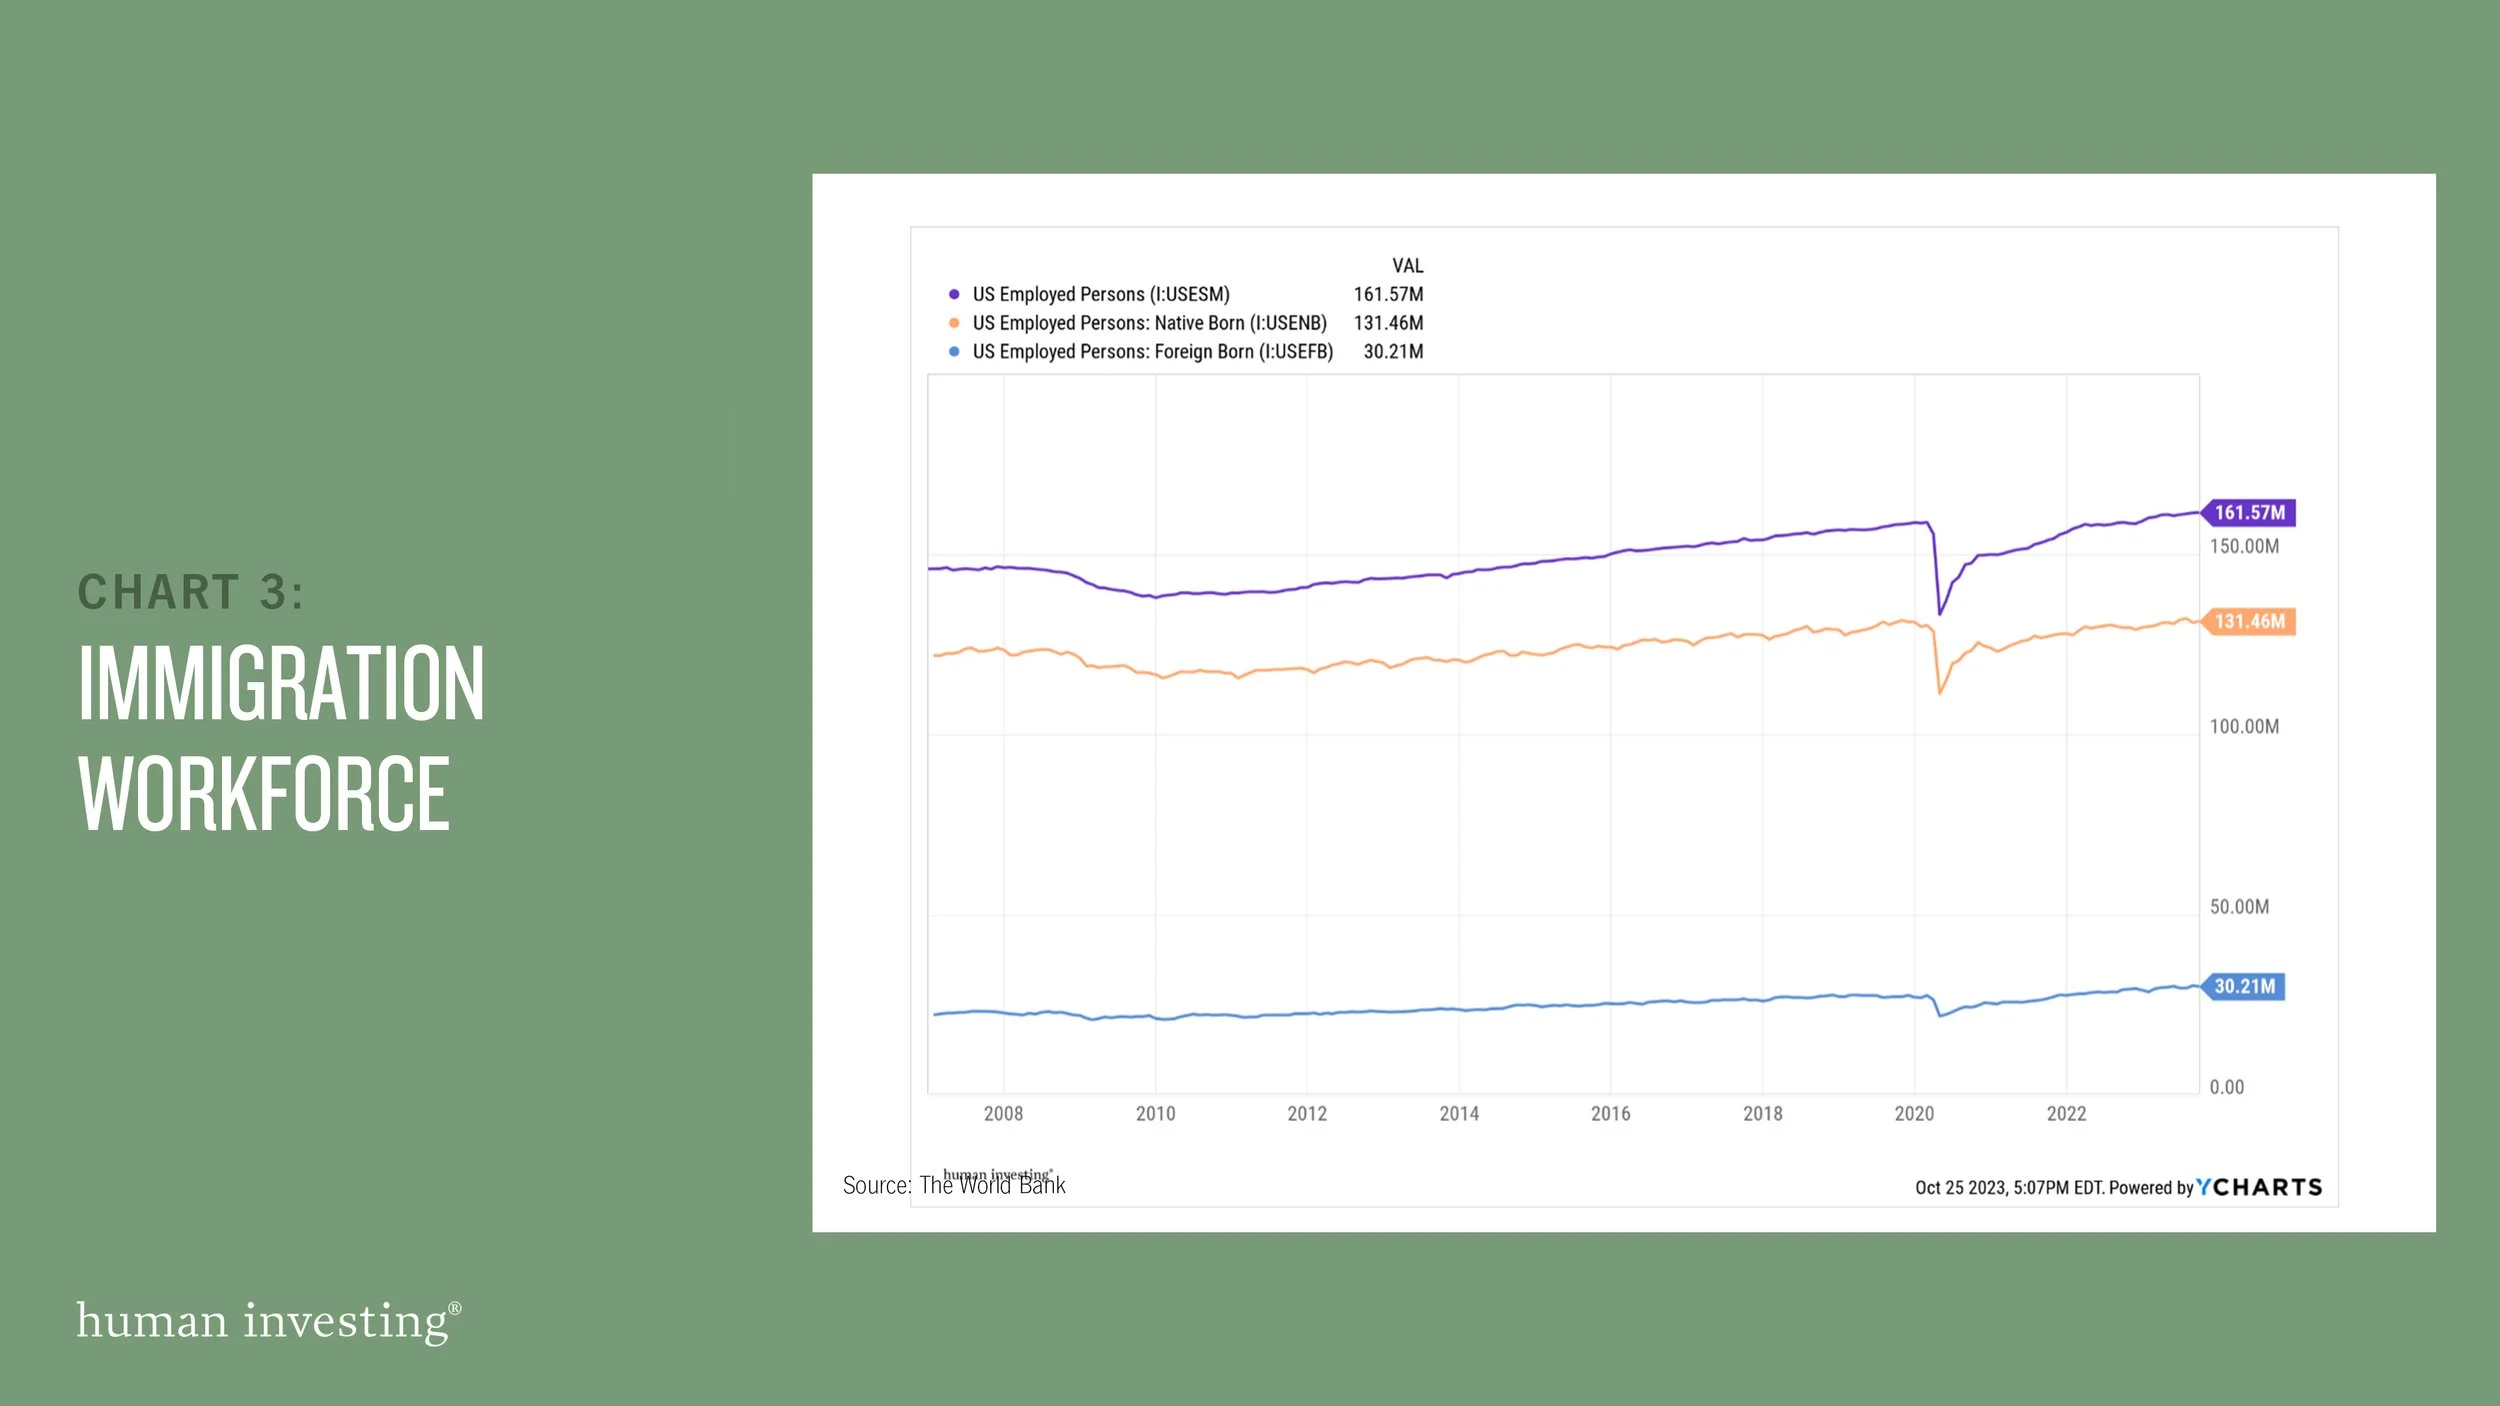
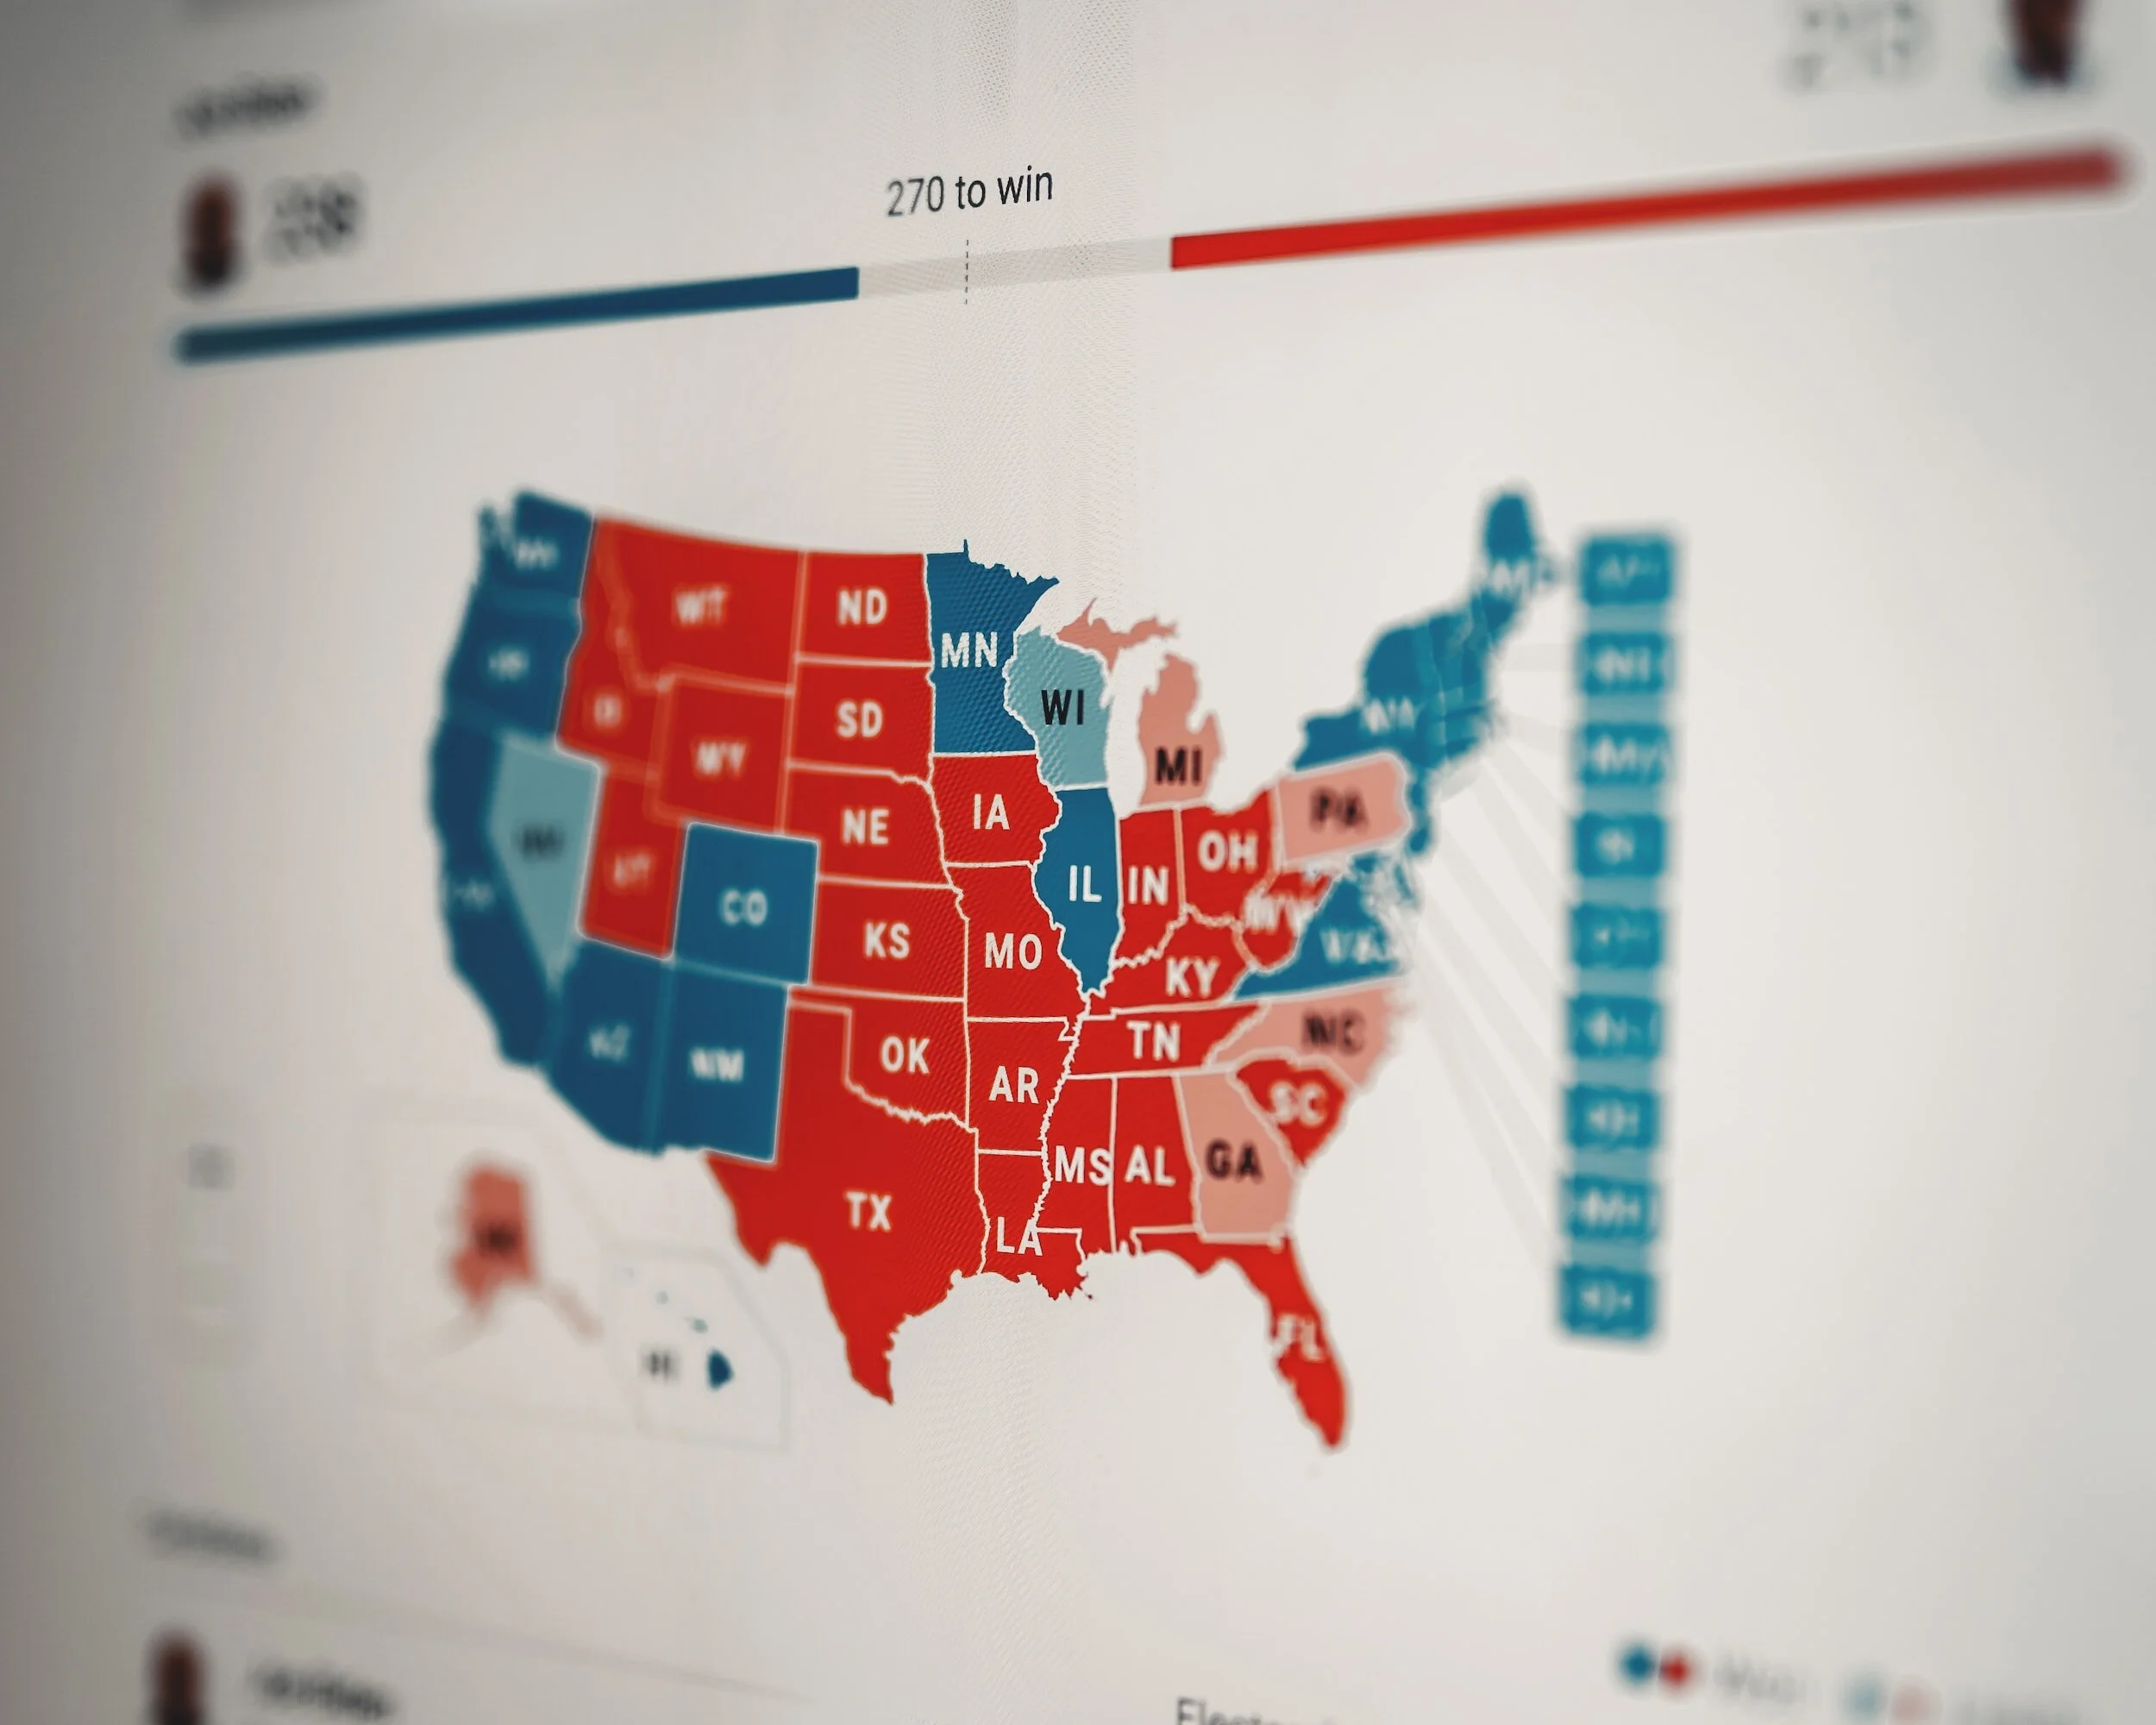
Implementing a policy permitting increased immigration could boost the size of the workforce in America. However, this is a politically contentious issue, and the legal framework around immigration is too uncertain to make reliable long-term predictions. Overly restrictive immigration policy could lead to a labor shortage, and too permissive immigration policy could cause a labor surplus. Foreign workers constitute approximately 20% of the US workforce.

A tighter labor market has some benefits for workers

The scarcity of labor translates into more choices when seeking employment and enhances the bargaining power of job seekers. Companies will have to consider their recruitment and retention policies to ensure they have the workers required for optimal performance. US wages and salaries are remaining above inflation, showing workers ability to demand higher compensation.

A tighter labor market plus higher wages could equal higher inflation rates

However, higher wages also entail increased costs for companies, and the allocation of these costs, whether to customers or shareholders, may result in higher inflation or reduced earnings. To counter inflation, the Federal Reserve has been increasing and maintaining higher interest rates. Many are apprehensive that the tight labor market (associated with demand-pull inflation) and ongoing post-COVID supply chain challenges (linked to cost-push inflation) could make achieving the long-term target of 2% inflation more challenging.

In Q3 2023 we observed inflation rates increasing from just below 3% in June to 3.7% in September. Many consider unemployment and inflation to have an inverse relationship. A tighter labor market may necessitate the Federal Reserve to persist with a more extended and aggressive tightening policy to manage inflation. If the Federal Reserve becomes overly aggressive in its tightening efforts, the concerns that led many to anticipate a 2023 recession could materialize.

All of this hinges on the tight labor market persisting. Technological advancements have the potential to enhance productivity to a level where a smaller workforce can achieve more and sustain economic growth. Modifications in immigration policy could either introduce a new source of workers or further reduce the size of the workforce.

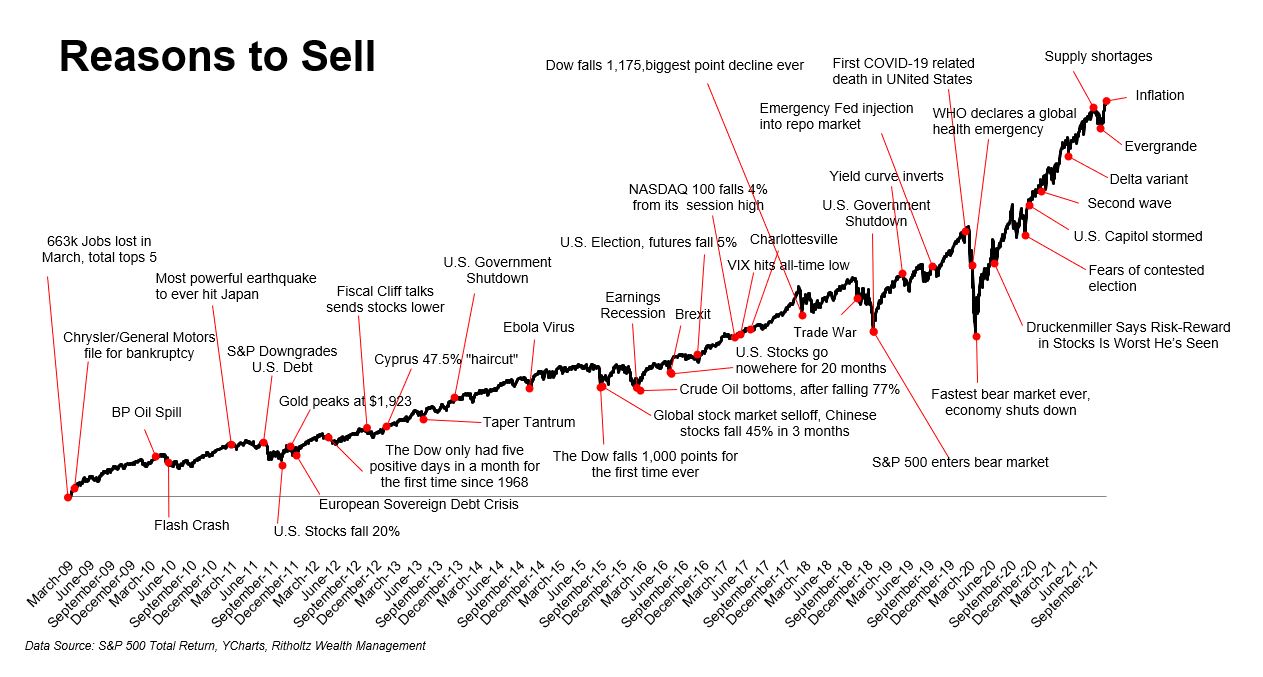
In the long run, successful companies will adapt to the new environment and thrive. A diversified portfolio will continue to capture the growth of the companies that excel. We encourage investors to be prepared for a myriad of reasons to be nervous, and understand given time the market will figure things out and continue to grow.


Related Articles

The IRS Has Increased Contribution Limits for 2024
 

There is good news for retirement accounts! The IRS has increased the contribution limits for the upcoming year. As you can see below, there are many notable changes that will allow investors to save more money. One important update for 2024 is that 401(k) elective deferrals increased from $22,500 to $23,000. That’s not all! Please see below for the applicable updates for the coming year:

How do these changes impact your savings in the upcoming year? Are there any changes you should be making? Use this link to schedule a time to meet one-on-one with our team. We look forward to working with you in 2024!


Related Articles

Savvy strategies every homebuyer should know in a competitive market


In today's challenging real estate market, prospective homebuyers face stiff competition and rising costs. However, there are creative ways to navigate these hurdles and secure your dream home, second home, or investment property. Here are nine strategies to consider, that can make a significant difference in your home-buying journey:

1. Seller Concessions

Don't hesitate to ask sellers for concessions to help cover your closing costs and escrow reserves. This can ease your financial burden during the transaction.

2. Borrow From Equity

If you own a home, consider tapping into its equity to fund your down payment and closing costs. Options like refinancing or taking out a home equity loan can provide the necessary funds.

3. Escalation Clauses

Work closely with your realtor to include an escalation clause in your offer. This can help your bid stand out in multiple offer situations by automatically increasing your offer amount to surpass competing offers.

4. Buying Points

Discuss the possibility of buying points with your lender. This upfront investment can reduce your interest rate and lower your monthly principal and interest payments over the life of your mortgage.

5. Rent-Back Options

Negotiate a rent-back option with the seller. This arrangement allows you to stay in your current residence for a period after closing, giving you more time to move.

6. 401k Loans

Consider taking out a loan against your 401k for your down payment and closing costs. Be sure to understand the terms and implications before proceeding.

7. Low-Down Payment Programs

First-time homebuyers should explore no-down payment and low-down payment programs. Many government-backed loans and assistance programs can help reduce your upfront costs.

8. Credit Union Referrals

Reach out to your credit union for real estate broker referrals. Working with an experienced and trustworthy real estate agent can be invaluable in navigating a competitive market.

9. Gift Funds or Equity

Explore the possibility of using gift funds or gift equity from family members to cover your down payment. Ensure you meet the lender's requirements for documenting these funds.


Be creative and resourceful

In conclusion, purchasing a home in a challenging market requires creativity and strategic thinking. By leveraging these approaches, you can enhance your chances of securing your purchase while managing the financial aspects of the transaction. Stay informed, work with experienced professionals, and be bold while exploring these options to make your home-buying journey successful.


Related Articles

The FAFSA is getting retooled this winter: Everything you need to know


A much needed update for families

The Free Application for Federal Student Aid (FAFSA) Simplification Act of 2021 was passed by Congress for many reasons. For starters, the calculation was originally defined over four decades ago in 1972 and is in some need of updating. According to the National College Attainment Network (NCAN), only 61% of seniors applied for aid in 2017 and 54% in 2021.

Some consider COVID to be the main culprit for this sudden drop, but the complexity of the form is the other main issue. Currently, students are required to answer 100+ questions depending on their family's income level. As of now the new FAFSA form changes are set to be released in December 2023 and students and parents alike need to be aware of the specific aspects that will apply in the 2024-2025 academic year that may impact aid eligibility depending on their family situation.

What’s changing and why it matters

1. EFC (Expected Family Contribution) replaced with Student Aid Index (SAI)

Short answer: Fairer access to funds for lower-income households.

One of the more obvious changes was renaming the EFC to the SAI. The goal was to not only reduce the confusion around the actual costs of college and what families are responsible for paying but also ensure access to Federal Student Aid programs including Direct Student Loans, Parent PLUS Loans, Work-Study programs, and even Pell Grants for low-income households. This number can be negative with maximum Pell Grants awards giving a student up to -$1,500 in money back. Time will tell but the largest impact will fall on middle to upper income families who will no longer be able to divide the number of college students in the household that are currently in college. For example, a family that could pay $40k/year could split the aid evenly between the number of students in college at the time. They no longer have this luxury and will see a reduction in aid.

2. Custodial parent status changes

Short answer: For non-married couples, the parent who ultimately claims the child as their dependent on their tax return will submit the FAFSA.

Currently, the FAFSA only collects income and asset data from the parent a student lives with. In cases of divorced, separated, or non-married couples who reside together starting in 2024-2025 school year, the SAI calculation factors in the parent who provides the greatest financial support. In cases of divorce and separation starting in 2023 the SAI calculation will only require the parent who provides the majority of “support” to fill out the FAFSA. One household might pay the child support but the other pays for the mortgage, groceries, and sports clubs. The implications of this decision can be significant.

3. Formula changes

Short answer: Students can qualify for more awards.

As with the SAI calculation, the number of students a family has in school is no longer a factor for Pell Grant eligibility. By completing the FAFSA, you are considered for the maximum amount of Pell grants first (based on number of people in your household) and your AGI (Adjusted Gross Income) compared to the FPL (Federal Poverty Line). If not eligible, your maximum Pell Grant amount will be subtracted by the SAI. Finally, you will still be considered for a minimum Pell Grant if no award is given. These other factors in the formula for aid are listed in no order but should be noted for your situation.

The student income protection allowance threshold was raised from $6,800 to $9,400.

  • Businesses and farms that employ 100 or more employees will be considered an asset going forward

  • Capital Gains from the sale of investments will be considered income on the FAFSA

  • Child support received is now reported with assets NOT income

4. Student income from outside sources

Short answer: A student’s financial aid won’t be penalized for withdrawing 529 funds early.

Currently students must report gifts or distributions from a 529 owned by a non-parent (e.g. grandparents or other family members) or non-custodial parent if the student's parents are divorced. Due to the FAFSA’s prior income year rules, a student who needed access to those funds before Jan. 1 of their sophomore year of college would be penalized in the formula for the withdrawal. Now they are completely removed from the aid formula calculation.

5. New student allowances for the cost of attendance

Short answer: FAFSA will cover more day to day student expenses.

Although these are smaller changes, college students alike must not overlook these valuable new allowances that the FAFSA will allow students to claim for ancillary items. Not only is there a small allowance for personal expenses if a student works part-time but a personal computer purchase with no enrollment status requirement. You can even have an allowance for transportation between home, work, and school. More details can be found here.

Proactive financial aid resources to guide your family

For a current or future college student, utilize the free Student Aid Estimator.

If these changes make need-based options harder to attain, look for colleges that offer merit scholarships. This does not mean forgoing the FAFSA completely but intentionally seeking out Merit scholarships at specific institutions. This process, known as Early Action, is detailed in this article with a list of colleges that offer Merit Aid. We recommend starting this process early as many colleges recruit students as early as late spring of your child's junior year!

Finally, contact financial aid offices to see if they will be awarding institutional dollars based on the current formula not connected to the EFC/SAI numbers.

We can help with education planning

The FAFSA is changing for better or for worse and will affect how parents and students think about college for years to come. If it would be helpful to consult a team of credentialed advisors with expertise in college planning, schedule a call here.


Related Articles

2023 Q3 Economic Update: What’s behind the market rally


What recession?

As prognosticators assessed markets and the economy in the beginning of 2023, the expectation for many was a tumultuous year,  with a substantial likelihood of a recession. Now, nearly two-thirds of the way through the year, the S&P (Standard & Poor) 500 has surged by 18.73% through the end of August. Real GDP (Gross domestic product) has maintained steady growth, with quarterly increases of at least 2% since Q3 2022. Inflation, which began the year at a daunting 6.4%, has receded to 3.18%, still above The Fed's 2% long-term target but showing a marked improvement.

What changed given the gloomy expectations for 2023 at the start of the year? The biggest unknown was the impact of The Fed’s decision to continue raising interest rates. The expectation was that The Fed raising interest rates to cool inflation would cause an economic recession. We’ve even seen rising rates play a role in multiple banks failing earlier in 2023, but those events haven’t triggered any distress.

We’ll break down the top themes for why we’re seeing the markets and economy continue to power through.

Theme #1: Strong job market

Inflation has gone down, but GDP growth remains positive, and unemployment remains low. There are still 3 million more job openings than job seekers, and few were expecting The Fed to get this far on inflation without dipping the economy into a recession. Even experts have a difficult time accurately predicting where the markets and the economy are going.

Theme #2: ‘Soft landing’ of interest rate hikes

In contrast to the substantial interest rate hikes witnessed in 2022, the changes in 2023 have been modest. A significant contributor to the slowdown in interest rate hikes was the decline in inflation during the latter part of 2022, which has persisted into 2023. Consequently, The Fed didn’t need to enact as many rate increases, or do so as rapidly as they did in 2022.

Theme #3: Surprising growth from S&P 500 companies

The S&P 500’s rise has a couple of factors going for it. While 2022 saw a decline in earnings per share for S&P 500 companies, 2023 has witnessed earnings growth, with expectations that growth will continue. Analysts are feeling increasingly optimistic that companies will find a way to bolster earnings amidst a higher interest rate environment.

The other piece of the puzzle is the exceptional performance of the largest stocks within the S&P 500 this year. The S&P 500 is a market cap weighted index, meaning that each stock is weighted based on how large the company is. This means AAPL has a bigger weight than Home Depot, and AAPL being up 10% would increase the S&P 500 performance more than HD (Home Depot) being up 10%.

In 2023, returns have been concentrated in a few high-performing stocks. Put differently, only 28% of stocks in the S&P 500 have outperformed the index. This highlights the dominance of a handful of top performers in 2023. It’s worth noting 61% of stocks in the S&P 500 have achieved positive returns for the year, indicating favorable performance across the stock market.

Source: Data for this paragraph is based on using IVV (iShares Core S&P 500 ETF) holdings. Positions were all verified to be held 12/30/2022 and 8/24/2023 to ensure consistency of constituents. Average returns assumes equal weighting of the positions. Top 10 holdings are based on 8/24/2023 weighting: AAPL, MSFT, AMZN, NVDA, GOOGL, GOOG, META, BRK.B, TSLA, UNH. Jan-Aug performance data courtesy of YCharts as of 8/31/2023 market close.

Theme #4: Mid and small sized companies are not far behind

Many talk about the S&P 500 as though it represents the entire stock market. However the S&P 500 represents the largest companies in the US (typically $14.5 billion and greater), leaving out companies considered mid-sized and small.  The mid and small parts of the US markets have been lagging, still positive returns but not as high.

Source: All data courtesy of YCharts. Assumes S&P 500 for US Large, S&P 400 for Mid, S&P 600 for Small, and S&P 1500 for Total Market (blend for all). Uses Value & Growth versions of benchmarks respectively.

Predicting short-term MARKET outcomes continues to be difficult

Short-term value oriented investors may be frustrated to see their performance lagging the broad market. Alternatively, longer-term investors recall seeing a significant benefit in 2022 by experiencing less negative returns than the broad market or growth stocks. You are still positive from the start of 2022 to the end of August 2023. Growth and blend investors are still waiting to recover from the downturn. Trying to time when value or growth will outperform is not recommended. Find an investment style that suits your risk tolerance and financial plan, and be prepared to stick with it for the long haul despite periods of under or over performance.

The year 2023 so far serves as a compelling illustration of how stocks can still generate positive returns even in the face of grim expectations. It is also a great reminder of how difficult accurately predicting the economy or the markets is. The outlook for the equities market is rarely all sunshine and rainbows. Stock market volatility means that short-term corrections are always on the table. There are and always will be valid concerns that could lead to a downturn. If you are choosing a particular tilt in your investments, be prepared to stick with it over time. Long term, equities remain the best way to grow your savings. It is valuable to remember and reflect on the times when you anticipated poor returns but were pleasantly surprised by positive performance.


Related Articles

The Ultimate Guide to Navigating and Lowering Taxes for Nike Execs and Leaders


A growing complexity

As a Nike leader, you are provided a comprehensive range of benefits that help achieve financial and retirement goals. The downside is that these benefits often create confusing tax implications. Multiple measures over the last few years have passed to increase taxes on high-income earners, including the Metro and Multnomah County taxes. These tax measures in addition to regular Federal and Oregon taxes are becoming an increasing burden for Nike executives. 

A clear understanding of the tax implications with these benefits is crucial. Employing appropriate strategies can both reduce your tax burden and also prevent any surprises during tax season in April.

Let’s examine the three biggest reasons you could get hit with a tax bill and review a recommended solution.

The 3 leading causes to tax surprises

1. Wrong tax withholding on supplemental pay

Many compensation sources at Nike beyond salary (such as PSP, LTIP/PSU vests, RSU vests, and stock option exercises) are taxed as “supplemental pay,” which come with a set percentage of tax withholding (22% Federal + 8% Oregon) regardless of your tax bracket or tax withholding elections on your salary. The reality is most Nike executives are in a much higher income tax bracket, sometimes as much as 17% higher than the amount withheld. This discrepancy leaves a significant gap in the amount taxes that should have been withheld versus the actual amount.

For example, Kate Executive has $100K of RSUs that vested on September 1st. With all her income sources (salary, PSP, LTIP/PSU, RSUs) her taxable income is $700K. The taxes automatically withheld on the $100K RSU vests would be about $30K (22% Federal + 8% State).  However, based on her tax bracket, Kate will owe another $17,000 on that RSU vest.

2. No tax withholding for Multnomah County’s “Preschool for All” tax

For those who live in Multnomah County, you are likely subject to the “Preschool for All” tax that started in 2021. Unfortunately, Nike does not withhold taxes from payroll to cover this tax, so you will be responsible to fully cover this on your own. Multnomah County expects these payments to be received quarterly to avoid interest and penalties.

The Preschool for All tax is 1.5% on taxable income over $125,000 for individuals and $200,000 for joint filers, with an additional 1.5% on taxable income over $250,000 for individuals and $400,000 for joint filers. The rate will increase by 0.8% in 2026.

3. No coordination of Portland Metro tax payments for 2 working spouses

Since Nike headquarters is located within the Portland Metro, they do withhold taxes for the Metro Supportive Housing tax (a.k.a. Homeless tax) that also started in 2021. The Metro Supportive Housing Tax is a 1% tax that is applied on income over $125,000 single filer or $200,000 joint filer. 

A common issue arises when you have two working spouses at different companies, since the income threshold for this tax is based on household income and the two different employers obviously do not communicate with each other.   

For example, once a Nike executive’s income reaches $200K, Nike will start to withhold the Metro tax on any income above that amount. However, the other spouse’s employer does not know about the income at Nike and assumes that the spouse’s income is the household income. So, if that spouse earns $90K, no Metro tax is withheld on that amount even though all of it is subject to the Metro tax.

The 3 tax payment issues identified above often lead to a frustrating situation, where you either end up with a significant tax bill in April or you have been paying in the wrong quarterly estimated tax payment amounts given to you by your CPA.

Our recommended solution: The pay as you receive strategy

For many Nike executives, setting aside additional tax payments into your monthly household cash flow can become stressful, since the amounts can be so inconsistent.   

The “Pay as You Receive” strategy is calculating the estimated amount of taxes due from each type of “Bonus Compensation” as you receive it and making those tax payments at that time, while you have the funds to do it. This will leave your monthly cash flow separate and unaffected.

If this sounds like a lot of work, you can make it simpler by applying this method during 2 key time periods. 

  • Time Period #1: August – PSP, LTIP/PSU bonus’

  • Time Period #2: Early September: September 1st RSU vests

A more thorough approach is the also include any February retention RSU vests and stock option exercises as they occur.

These supplemental estimated tax payments, when combined with the withholding, should be equal to your anticipated tax bracket for the calendar year. This approach helps ensure that your total payment to the IRS, Oregon, Multnomah County, and Metro aligns with your tax obligations.

Additional strategies for minimizing your tax liabilities

If you’re looking for more tax savings or want to use your stock benefits to take care of tax payments, we highly recommend proactive tax planning. This involves looking beyond the past year and anticipating opportunities to reduce taxes in the future.

Proactive tax planning common solutions include:

1. Maxing out your Nike 401(k) with pre-tax contributions

This is a simple strategy, yet it is often missed.  With the maximum contribution amount increasing periodically with inflation and with opportunities for additional catch-up contributions at age 50, forgetting to review your contribution percentage each year is common.  We recommend reviewing your 401k contribution amount after your PSP bonus is paid, since it is a variable amount that is part of the equation.

2. Selling the right type of Nike stock

If you ever need funds from Nike stock, find the most optimal type of Nike stock to sell to minimize your taxes. Typically, RSUs are preferred over ESPP from a tax standpoint, but this can depend on when it was purchased/vested, how long it has been held, and what the stock price is at the time.

3. Utilizing the Nike deferred compensation plan to defer your taxable income to a later date 

Nike’s deferred compensation plan is generally the most powerful tax savings tool available for Nike leaders.  There are specific IRS rules and many important considerations to plan around when using this strategy.  To learn more click here.

4. Charitable giving

Most people assume that all donations to charities are tax-deductible.  They can be tax-deductible but are not always, depending on your individual tax situation. To receive a charitable deduction, you need to exceed a certain threshold each year, and it may make sense to “bunch” donations (make multiple years-worth of contributions in a year) to cross that threshold and capture tax benefits. Coordinating your charitable strategy with the Nike charitable match can be an effective way to lower your taxes and benefit your desired charities at the same time. To find out more click here.

5. Residence planning

If you currently live in Multnomah County, you might consider moving to another county, such as Clackamas or Washington Counties, to avoid the Preschool for All tax. This solution should consider the estimated tax savings compared to the cost of selling your home, the tax implications of selling your home, the purchase price of a new home, and the difference in a new mortgage payment (especially because mortgage rates have increased significantly).

6. Planning around the Oregon state kicker

Oregon law has a provision known as the “kicker” credit. This is a surplus credit that is returned to you on your tax return when tax revenue is larger than predicted.  By accounting for this, you can strategically recognize more income in “kicker” qualifying years so that your potential kicker credit is increased.  The last kicker payment was 17.34% of the Oregon taxes you paid in 2020 and the next one is estimated to be even larger

Bring in experienced experts

By implementing a proactive forward-looking tax strategy and payment plan, Nike leaders have a significant opportunity to improve their financial situation and relieve stress related to taxes. It is important to note that any tax payment and mitigation strategies should be part of a comprehensive financial plan that is tailored to your specific financial situation.

If you have questions about how to set up a proactive forward-looking tax strategy, please contact our team to learn more.


Related Articles

Economic Update From Human Investing: Yield Curves


What is the yield curve?

The yield curve refers to the current yields of US treasury bonds based upon time until maturity. It’s frequently depicted as a graph to help summarize the data. Typically, a yield curve is upward sloping. Short-term (ST) rates are lower, and long-term (LT) rates are higher.

Wall Street Journal, Bonds & Rates: Yield Curve, April 25, 2023

Reading the yield curve:

  • A “steeper” or “steepening” of the yield curve means short-term (ST) rates are lower, and long-term (LT) rates are higher, resulting in a steeper line when comparing

  • A “flatter” or “flattening” of the yield curve is when ST rates and LT rates are equivalent, or are getting closer to parity

  • An “inverted” yield curve is when ST rates are higher than LT rates, like the current line in the snapshot above.

What determines the yield curve?

All rates on the yield curve are determined by the market. The Fed only controls the federal funds rate, which is only the rate banks lend to each other overnight. Because the market determines the shape of the yield curve, many look to the yield curve as a summary of overall investor sentiment to draw conclusions about expectations for the future. Some important market factors that influence the yield curve include:

  • Liquidity (time horizon): The more time until a bond matures, the longer you have your money tied up. As a result, a longer time to maturity (and lower liquidity) bond tends to have a higher yield. This contributes to an upward sloping yield curve.

  • Growth expectations: If there are higher growth expectations, you tend to see a steeper yield curve. This is because higher growth tends to lead to higher inflation, and so rates must be higher to achieve positive real returns.

  • Demand: As more investors demand a bond, the price goes up. As bond prices go up, yields go down.

Why is the yield curve inverted, and why does that indicate a recession?

The yield curve is inverted because ST rates are higher than LT rates. This is largely due to The Fed raising interest rates to lower inflation. The Fed appears determined to reign in inflation, and has raised ST interest rates to slow down the economy enough to reduce inflation. This is putting upward pressure on ST rates. Many expect this approach to cause a recession, which would lower growth expectations, reducing LT interest rates. The result is the inverted yield curve we see today.

Why does this inversion indicate a recession?

In theory, the market is pricing treasuries so the returns over a given time period are the same, regardless of what you buy today. Let’s use an example to illustrate this.

Say you want to invest $10,000 in treasuries for 2 years, you can make two choices:

  1. Choice #1: Buy a single 2 year treasury

    • Currently a ~4.2% yield, so you earn roughly 4.2% for 2 years.

  2. Choice #2: Buy a 1 year treasury today, then a new 1 year treasury in 1 year:

    • Currently a ~4.7% yield, so you earn roughly 4.7% for 1 year.

    • After the first year, your treasury will mature, and you will have to purchase a new treasury at whatever the current rates are. The yield curve today is predicting 1 year rates will be at 3.7% in the following year.

    • Your overall return after averaging those rates for each year is 4.2% — the same as buying a 2 year treasury initially!

A lower rate in the future indicates lower growth expectations at that time. Growth expectations being lower (or negative) does not bode well for the health of the economy. The inverted yield curve also has a solid record of predicting recessions, but that doesn’t mean it’s perfect or guaranteed. The yield curve reflects the average sentiment of the markets, which indicates what expectations are. Sometimes expectations create a self-fulfilling prophecy situation, and sometimes expectations are flat out incorrect because of an unexpected shock, like the COVID-19 pandemic.

What does this mean for me and my portfolio?

Ultimately your portfolio should be allocated for the long term, and that should be positioned accordingly. While the inverted yield curve has been a strong predictor of recessions, the timing of that prediction and how significant it’s going to be are not consistent enough to provide an easy 5 step solution for everyone.

If you are positioned towards the more aggressive end of what you are comfortable with, consider reducing risk with some volatility expected on the horizon. Understand that regardless of the yield curve today, the long run expectation is growth and positive returns for the economy and equity markets.


Related Articles

Planning Your Child's Education in Oregon With a 529 Plan
 

The cost of education, especially 4-year accredited university programs, continues to rise. The graphic below shows the average annual cost of college nationwide from 1980-2021 far outpacing the maximum Federal Pell Grants offered over the same time period. 

If there is an ability to pre-fund college, in whole or part, it will have lasting financial implications. Funding college early at the birth of a child or grandchild to a college savings account could reduce the future funding liability by six figures. 

In this article, we will discuss some ways you can start saving for your child’s education.

The most popular option, the 529 Savings Plan

A 529 College Savings Plan is one of the most popular options when saving for college. Not only does the money you contribute to a 529 plan grow tax-free but any distributions used for qualifying education expenses (tuition, room & board, books, computer, etc.), are tax-free as well. In the past, qualified expenses were limited to just tuition and boarding but recently the government has expanded this list. Beneficiaries of a 529 plan can also use the money to pay for trade school, community college, or even a 3-month certificate program.  

Oregon has a state-sponsored 529 Plan that allows residents to receive tax benefits for contributions they make to a plan in the state. This gives you a triple-tax benefit. Contributions to fund the account have a tax benefit, growth is tax-free, and qualified expenses are tax-free. There are also private plans that qualify under Oregon-state law. As of 2023, contributors can receive up to $300 in tax credits depending on their filing status and household income. As of 2023, families can contribute up to $17,000 annually in a 529 account. Anything after that is considered a “taxable gift” and subject to gift tax laws.  

Another feature about 529s starting in 2024 and beyond is that any leftover money up to a lifetime amount of $35,000 can be rolled over into the beneficiary’s Roth IRA.. For example, let’s look at two parents who invested $50,000 into a 529. Their child received a full scholarship to the college of their choice. The child ends up only spending $10,000 to cover other expenses during their time in college. That student can then roll over a lifetime amount of $35,000 into their Roth IRA account, as long as they have earned income and the 529 account has been established for 15 years.  

Coverdell ESAs act very similarly to 529 plans due to the withdrawals being tax-free for qualifying expenses. However, contributions are limited to $2,000 per child annually and are only available to families below certain income thresholds. 

Special accounts: Uniform Gifts TO Minors Acts (UGMA) or Uniform Transfers to Minors Acts (UTMA)

UGMA or UTMA accounts can help you save for college but aren’t just reserved for education. These accounts are savings accounts that are controlled by a parent or guardian, known as a “custodian.” You can gift up to $17,000 per year (as of 2023) in assets that are held in a custodial account until the child turns the age of majority (Age 18 or 21 depending on the state). In Oregon, the dependent cannot take over the account until they are 21.  

The custodian of the account can use this money only for the benefit of the minor to pay for things like food, education, and living situations. 

Pre-pay for college tuition and tuition discounts  

Unfortunately, in Oregon, there is no State-sponsored pre-payment plan for college tuition. There may be some private ones, but they are expensive. Some people do this in other states to pay for the full tuition during the current year rather than wait 17-18 years when prices go up even more. For your reference, here are states that offer pre-payment programs.

There is also a program known as the State and Regional College Tuition Discounts. Oregon has several schools that are members of the Western Interstate Commission for Higher Education.  

For more information about this make sure to research the WICHE site and Oregon’s student aid site.

Alternatives to college that can fast track career development

Despite the rising costs of college, there are other options to consider. College is not for everyone and you may decide not to send your student to college right away if you cannot afford to do so.  

Many high-paying and rewarding career paths do not involve a college degree like: 

  • Computer programming and coding 

  • Loan officers 

  • Pilots 

  • Plant operators and managers 

  • Graphic designers 

  • Trades like plumbers, welders, carpenters, farmers, etc. 

  • Sales reps  

  • Business owners and managers 

Community colleges, trade schools, and certificate programs are a fraction of the cost of a 4-year college program and in most cases pay well with little to no debt. Plus, 529 Plans cover these types of education programs too (certain restrictions may apply).  

Some 17-year-olds may not know what they want to do yet. They can work a job, apprentice under an expert, or even start their own business and find their passion before committing to a major program in college.  

If you need more advice, financial planners and advisors can assist you with planning for your student’s future. These laws vary from state to state so talking with a team of experts who are knowledgeable in this area is a wise choice.  

If you are looking to hire an advisor, please connect with us.


Related Articles

Quarterly Economic Update from Human Investing
 

It’s a new year, and there are still plenty of old questions about the economy & markets. We thought diving into some questions about today’s economy would be helpful.

2023 Economic Outlook

Many different sources (See Table 1) forecast a recession for 2023. With The Fed combating inflation by raising interest rates, expectations are these moves will force the economy into a downturn. The extent of the recession may depend on The Fed’s actions. If inflation recedes quickly, and The Fed cuts rates or stops raising them, that could minimize a recession or possibly avoid a recession entirely—this is called a “soft landing.” If inflation persists, and The Fed is determined to lower inflation in the face of a declining economy, the recession could be worse. However, market forecasts expect The Fed to cut rates in 2023 in response to a recession. The Fed has yet to forecast those same rate cuts. Based on our observations, the odds are we will experience a mild recession in 2023.

2023 Investment Outlook

Despite the prospects of a recession, investments grow over the long run, and volatility is expected. As we’ve previously covered, it can take years for your portfolio to recover from a downturn. We have always seen markets recover to new all-time highs. With a looming recession, 10-year forecasts for US stocks remain positive.


Downturns present a buying opportunity for investors, particularly workers accumulating for retirement. Continuing to purchase when stocks decline is an excellent investment. Saving more when times are tough is challenging. Ensure you are in good financial shape: have 3-6 months of expenses saved in an emergency fund, pay off any high-interest debt, and consistently spend less than you make. Then consider increasing your savings. Increasing your contribution rate is a wonderful forced savings tool if you have a 401(k) or similar plan.
 
Markets and the Economy
You may have heard the market is forward-looking. We know the market is a flawed prognosticator because prices still adjust daily to reflect new information. Let’s examine how closely market bottoms coincide with recessions.
 
There have been 11 recessions since 1950, according to the National Bureau of Economic Research (NBER). Using the NBER’s trough dates (i.e., the end of a recession), we can compare GDP with the S&P to see when both hit their lowest point. Looking at Table 3, the S&P 500 tends to do one of two things:

  1. The market is at its worst about the same time as the economy.

  2. The market is at its worst approximately six months before the economy bottoms out.


There are some caveats. Market data is live, and markets are open every business day. GDP data comes out quarterly, advance estimates come out nearly a month after the fact, and aren’t fully revised until around 60 days after initial release. For both the market and economy, knowing when you’ve hit bottom is nearly impossible to determine in the moment. Because it’s difficult to know when the worst is over, we recommend staying invested amidst the potential short-term tumult.

Be prepared for some turbulence this year

Economists and market prognosticators are expecting there will be a recession in 2023. The severity of the recession will vary depending on The Fed. The Unemployment rate remains below historical averages at 3.5%. In November 2022, there were nearly 6 million more job openings than job seekers, suggesting the economy can handle some tightening. Trying to time the market or economy bottom remains a guessing game. Long term, the outlook for returns is still strong. Be prepared for some turbulence this year, knowing you are headed in the right direction long term.

Sources
1. Federal Reserve Bank of New York. The yield curve as a leading indicator. January 2023.
2. The Wall Street Journal. Economists in WSJ survey still see recession this year despite easing inflation. January 2023.
3. Bloomberg. Economists place 70% chance for US recession in 2023. December 2022.
4. Vanguard. Vanguard economic and market outlook for 2023: Beating back inflation. December 2022.
5. BlackRock. 2023 global outlook. January 2023.
6. Charles Schwab. 2023 market outlook: Cross currents. January 2023.
7. Fidelity. Global outlook 2023: New world disorder. January 2023.
8. Charles Schwab. Schwab's 2023 long-term capital market expectations. January 2023.
9. Vanguard. Market perspectives: December 2022. November 2022.
10. BlackRock. Asset return expectations and uncertainty: as of September 2022 November 2022..
11. Data courtesy of YCharts & NBER


Related Articles

Charts of the Year 2022
 

These are some of our favorite charts and graphs that told the biggest stories from 2022.

Stock Market Performance

Each year, the stock market has its narrative around why it performed the way it did. With 2022 coming to a close and, as of 12/21, the stock market down 17.31%, one of the narratives for this year has been persistent volatility. As the chart above shows, 2022 marks the most days (30) that the market was either up or down 1%at the end of the week. 16 of the instances were down days, and 14 of the instances were positive.

In terms of additional narratives for this year, our team has been referencing a year like 2022 as a “price of admission” year. In other words, to receive the benefit of long-term equity returns, negative years (like 2022) are part of the price of admission to achieve the benefits. We reference this chart when looking at the negative headlines the market has overcome over the years.

INFLATION AND SAVINGS

With interest rates increasing rapidly, there have been many moving parts in all areas of the economy. From real estate to food prices, most industries have been impacted. One area that consumers/investors should look to take advantage of is their saving and checking accounts. During the most recent period of low-interest rates, we have become accustomed to these accounts paying little to nothing in interest. However, as the chart above mentions, Americans are leaving dollars on the table by not searching out higher interest bank accounts. Our team recommends utilizing a local credit union which often has new member checking benefits, or aggregator sites like NerdWallet do a good job of providing high-paying savings accounts.

Market Volatility

With all the market downturns and volatility, we thought it would be interesting to see how long it takes to make your money back, depending on how you are invested. Ensuring your allocations are positioned so you can ride out any downturns is essential for any investor. 

Job Market

It's been a unique time in the jobs market. Job openings have exceeded people searching for jobs by nearly 5 million for 2022. The persistence of this even with all the uncertainty around the economy and inflation is surprising. As a result of the pandemic, more people are seeking remote work. LinkedIn revealed that remote jobs, which take up 15.9% of job listings, attract 52.9% of job applicants.

FTX

2022 charts of the year wouldn’t be complete without referencing the rise and fall of the cryptocurrency exchange FTX. Even as I write this, new information surrounding this saga continues to emerge, and it will be a high-profile news story to follow into 2023.

The above chart shows how the organization’s value got as high as $32B as recently as January 2022 during FTX’s most recent round of funding. There are many lessons to be learned from fraud scenarios, and like you, we will follow this story into the new year.


Related Articles

2023 Tax Updates: Brackets and Rates Adjusted to Hedge Against Inflation
 

The IRS adjusts tax brackets and rates each year to account for inflation and combat “bracket creep.” Bracket creep is when taxpayers are pushed into higher income tax brackets or do not receive adequate credits and deductions due to inflation. Are you aware of how an increase in the standard deduction and tax brackets will impact you?

What has changed?

1. The standard deduction will increase for the 2023 tax year. See below for a summary of the increases:

 2. Federal income tax brackets will increase to account for inflation in 2023:

What does this mean for you?

While this is welcomed news, these updates will not significantly impact your taxes, cash flow, or budget. These updates are enacted to hedge against inflation and keep things consistent for taxpayers.

In sum, the increase in standard deduction means households will have less income subject to taxes, and the income subject to taxes will be subject to better tax brackets.

We wanted to re-vamp our tax example from 2022 with the updated 2023 numbers to provide a familiar and helpful guide to your taxes. Read on to see a fictitious example of the impact of the increased standard deduction and tax brackets in 2023.

Meet Martin & Angela

Below is a breakdown of their taxable income and taxes due in 2022 compared to 2023.

As you can see, they reported $100,000 of combined income, which is reduced by their pre-tax 401(k) contributions and the standard deduction of $27,700. Because the standard deduction increased from $25,900 in 2022 to $27,700 in 2023, Martin and Angela’s taxable income decreased. This means they are on track to pay less this year in federal taxes.

PORTIONS OF YOUR INCOME GET TAXED AT DIFFERENT RATES

Tax brackets calculate the tax rate you will pay on each portion of your income. Tax brackets are part of our progressive tax system, which means the tax rate increases as someone’s income grows. There are seven federal tax brackets in 2023 (see image 2).

As shown in the image above, Martin and Angela’s taxable income will be split to take advantage of the lowest tax bracket. This means they will be taxed at 10% on the first $22,000 of their joint income, and their remaining taxable income will be taxed at 12%. In 2022, the maximum income allowed at the lowest tax bracket of 10% was $20,550. In 2023, the maximum income allowed will be $22,000.

If Martin and Angela fall into a higher tax bracket in the future, their taxable income will be broken down into each respective bracket to take advantage of the lower rates on what they can.

DRUMROLL, PLEASE…

After completing this exercise for all their taxable income, you can see that Martin and Angela’s total taxes owed in 2022 is $7,881 compared to $7,636 in 2023. This means they will pay $245 less federal taxes in 2023 than in 2022. While this is welcomed news, it is not a life-changing update.

If you have questions about your unique tax situation, please schedule a time to connect with our team. As always, we would love to hear from you!

Disclaimer: This post is for educational purposes and not predictive of your 2022 tax situation. The fictitious example is not a complete presentation of a tax filing.


Related Articles